While reading through the OpenAPI specification and the Resource Query Language (RQL) gives you full information about Connect API, it might take some time to learn all of the endpoints and queries.
But what if you simply need to quickly learn how to automate particular action that you already know how to do in UI? In this case, you might want to simply “lookup” API calls from the browser itself as schematically illustrated below:
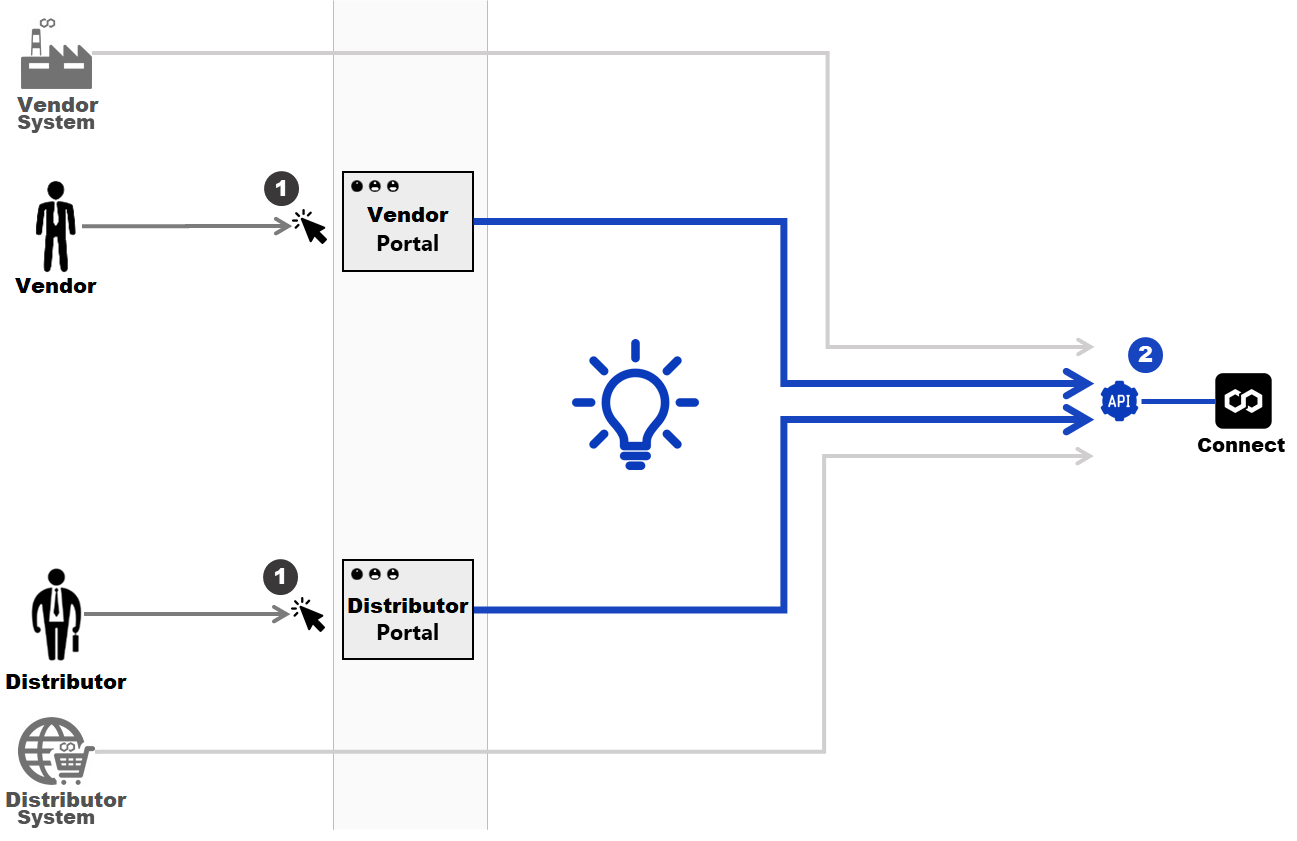
Due to the fact that Connect Portals are using the same public API, this technique might save lots of your time navigating around documentation to figure out what query to use.
All browsers have development tools that will allow you to inspect API calls. For simplicity of the article, we’re focusing on Google Chrome only:

While working with the CloudBlue Connect® Portal, open Development Tools by clicking at Inspect in the contextual menu:

You can see API calls in the Network tab:
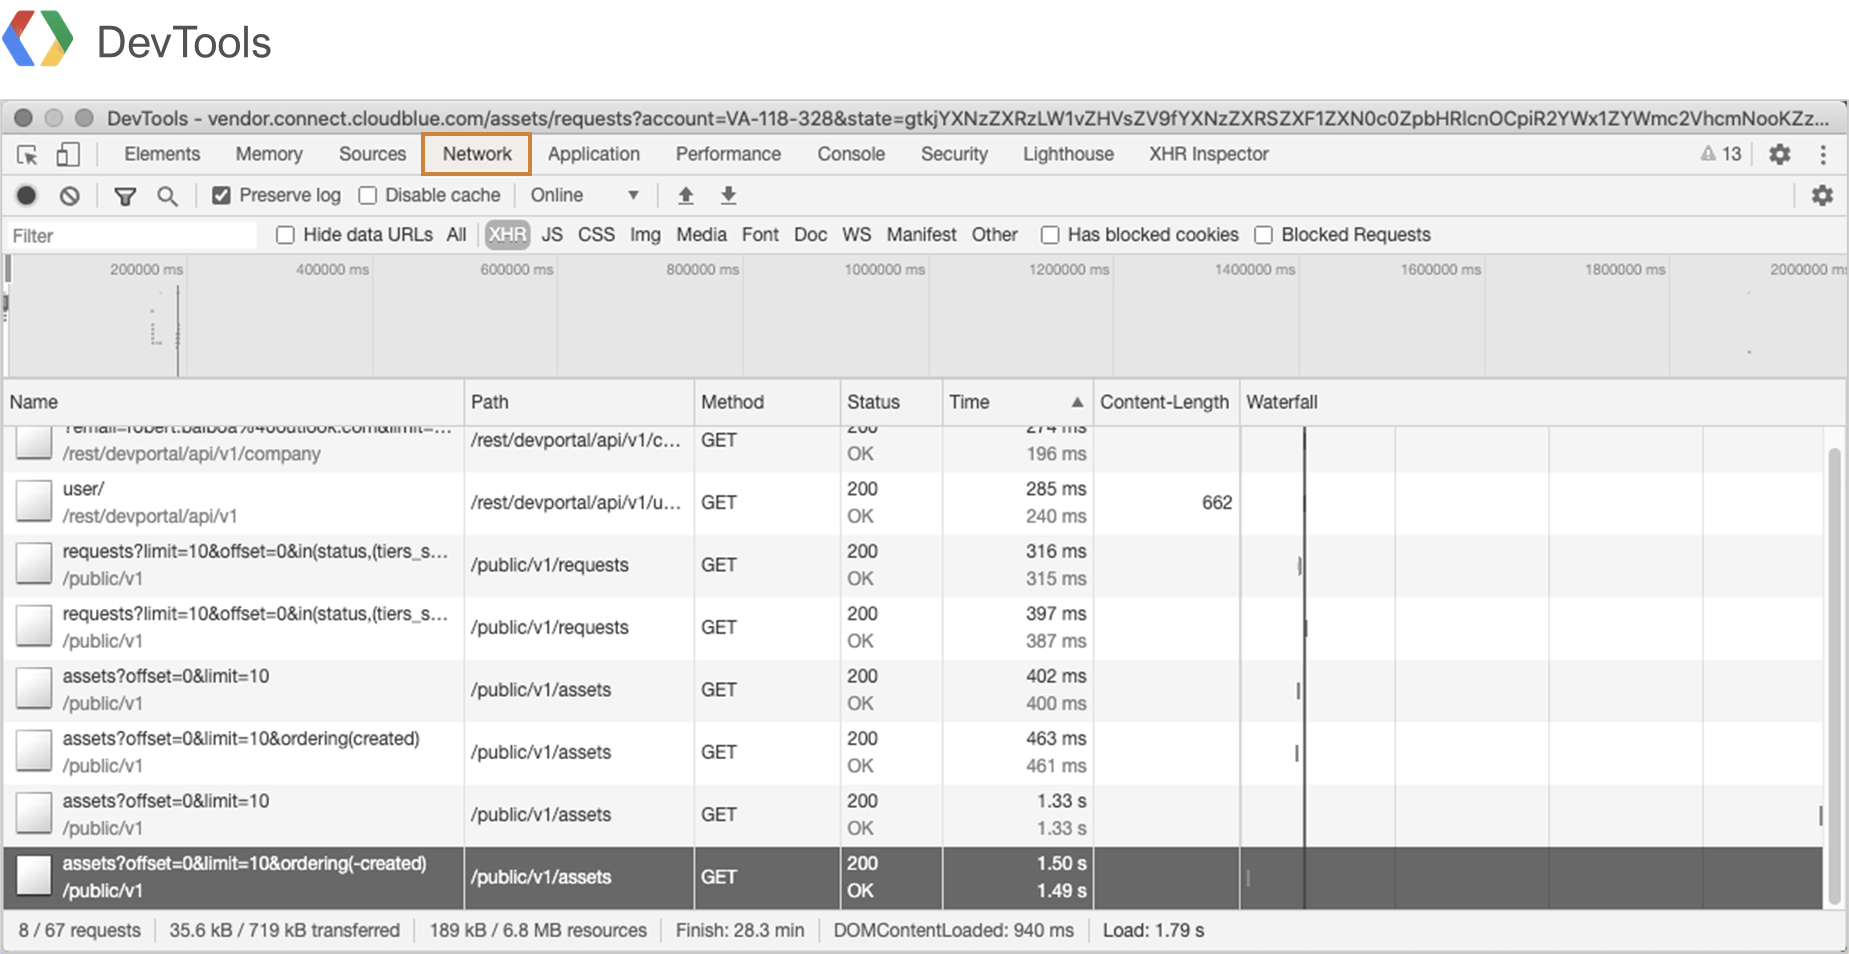
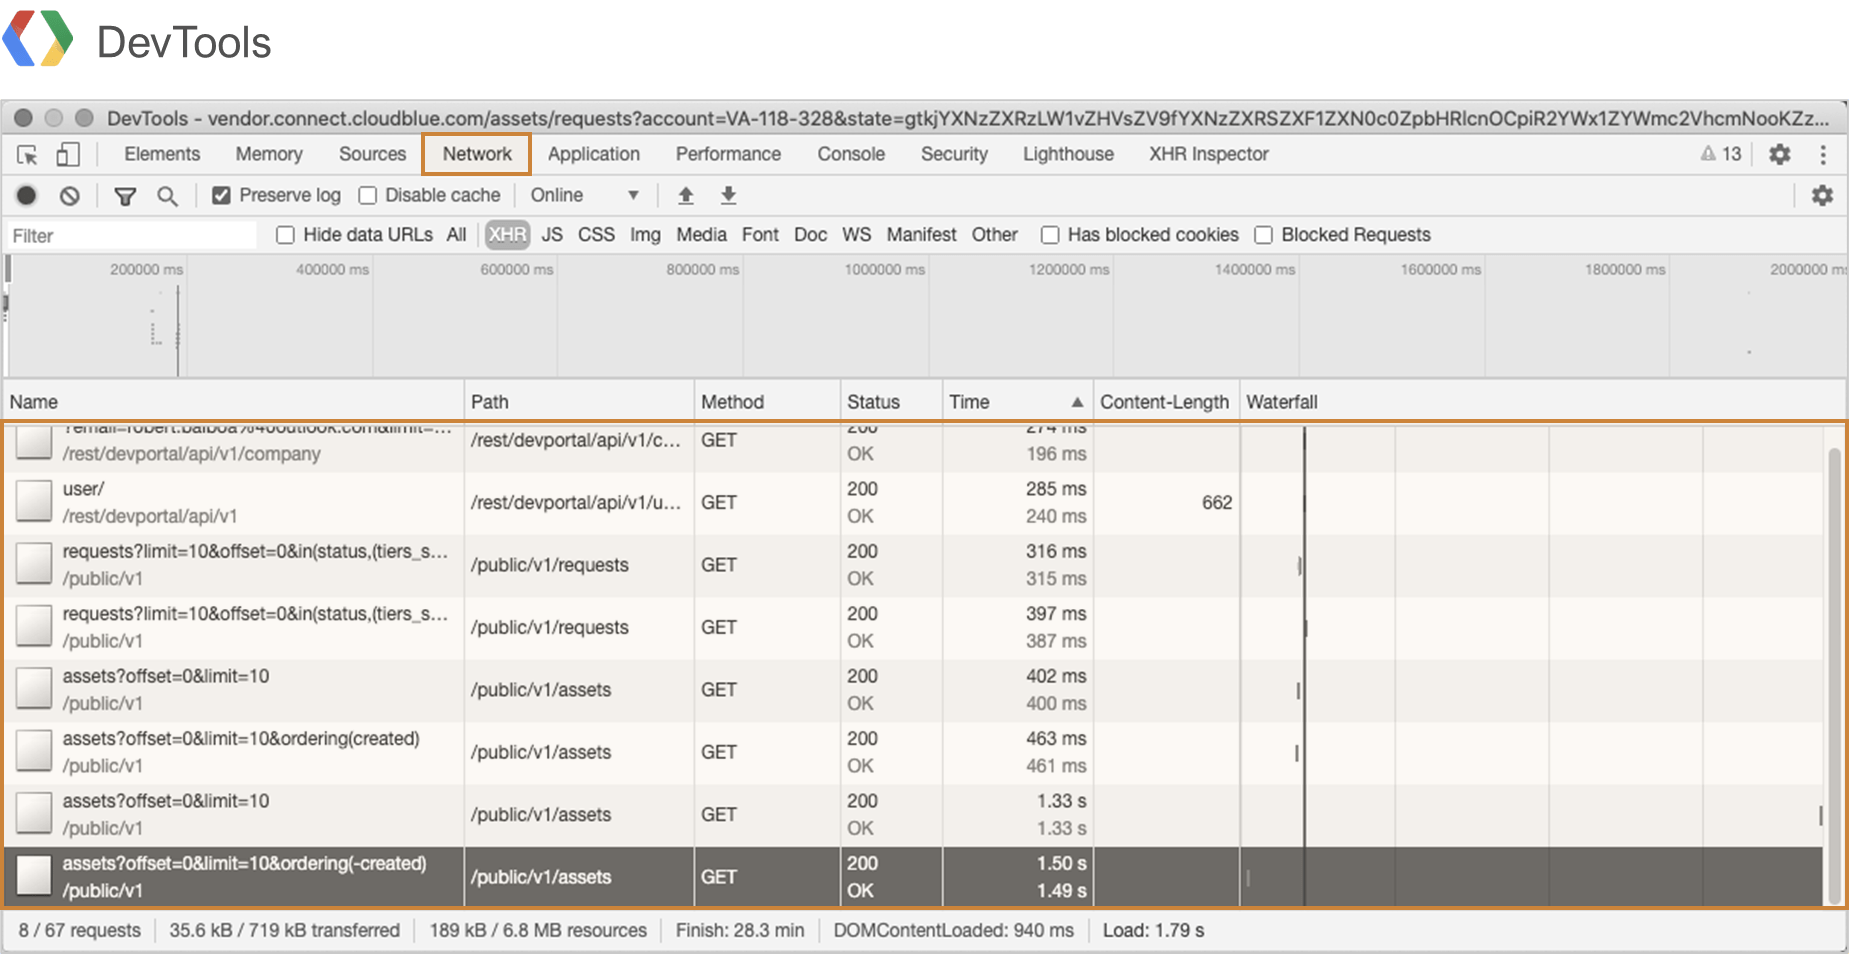
Filtering it by XHR requests only will help to remove unrelated queries.
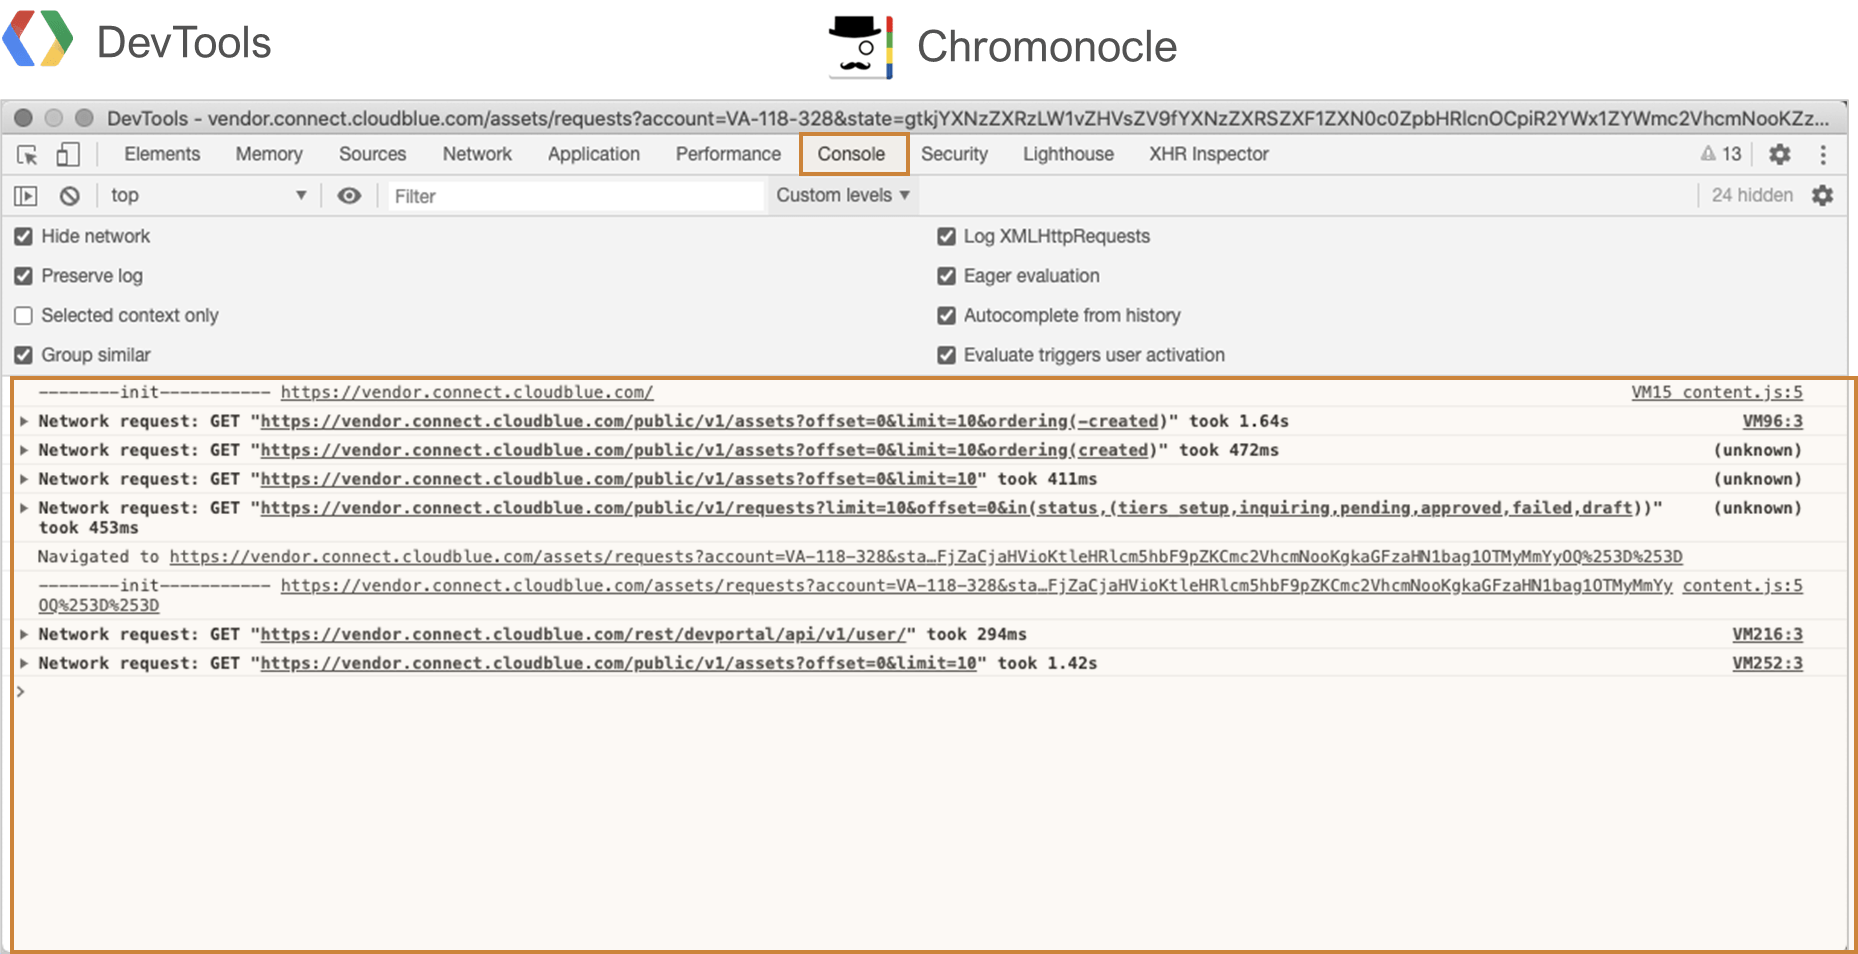
On top of the native Network tab, you might want to explore the Chromonocle plugin:

That will add the “Console” tab to the Development Tools with a bit simpler form of the queries:
Either way, this will allow you to quickly find the required API call and replicate it in your automation logic.
While copying queries to your REST clients please make sure to change the domain name to point to the actual API endpoint. I.e. when copying this:
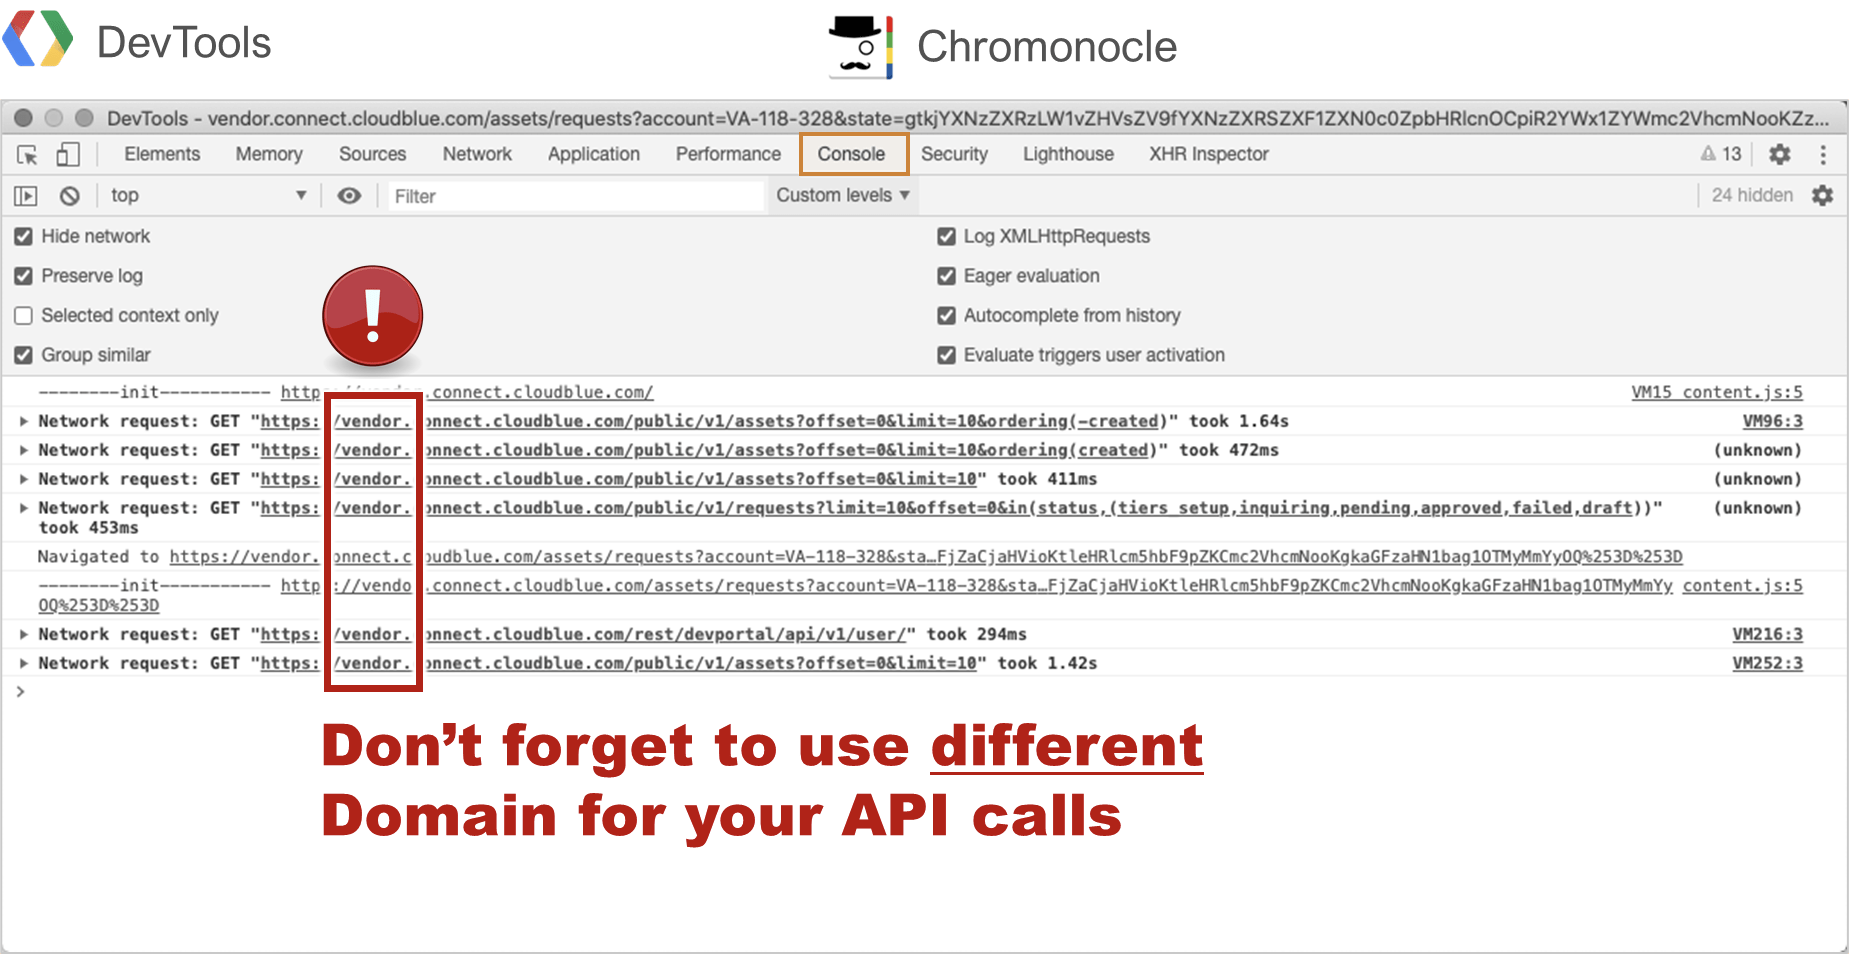
Make sure to replace domain name with the Connect endpoint:
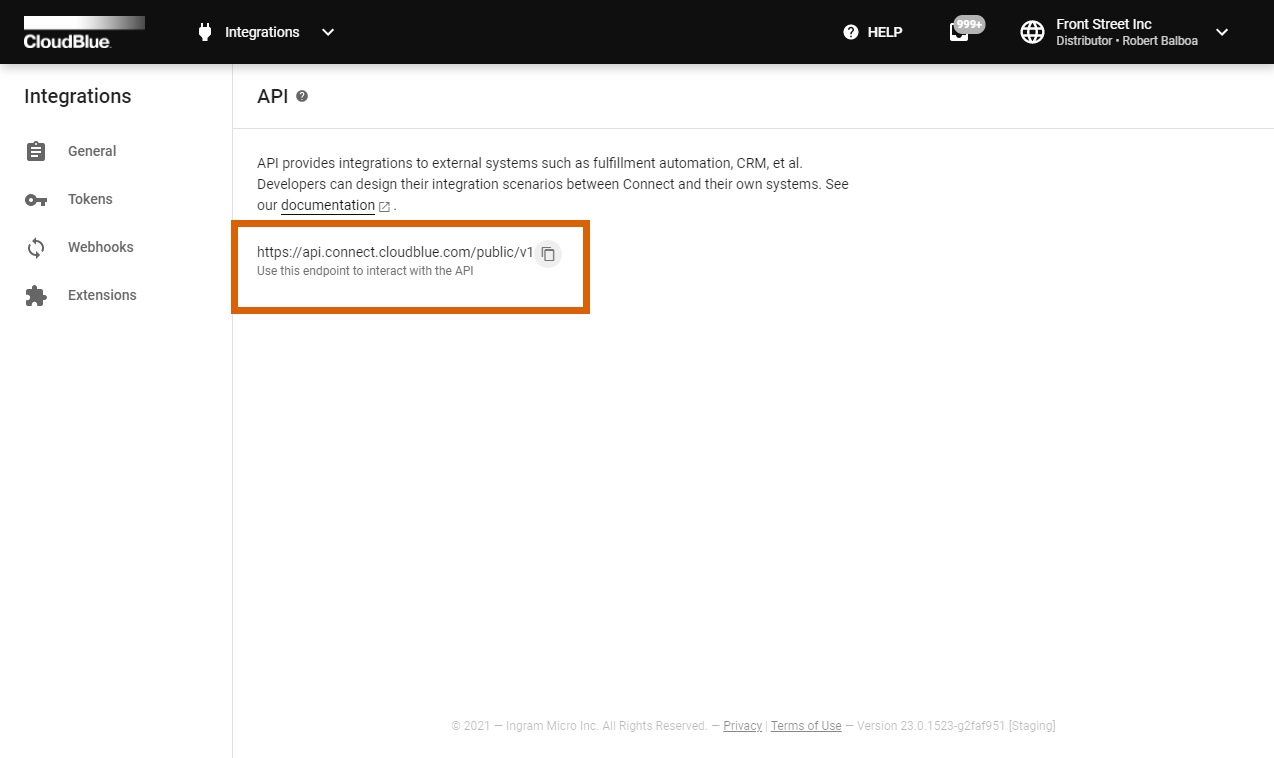
Access required API endpoint via the Integrations module of the CloudBlue Connect® platform.