The DevOps module on the CloudBlue Connect® platform is used to add and manage your extensions. This module is also used to monitor your deployed environments, manage your environment variable and settings, and accessing your logs and events.
Follow the instructions below to add your extension object and perform various operations with your extension on the Connect platform.
Adding Extensions
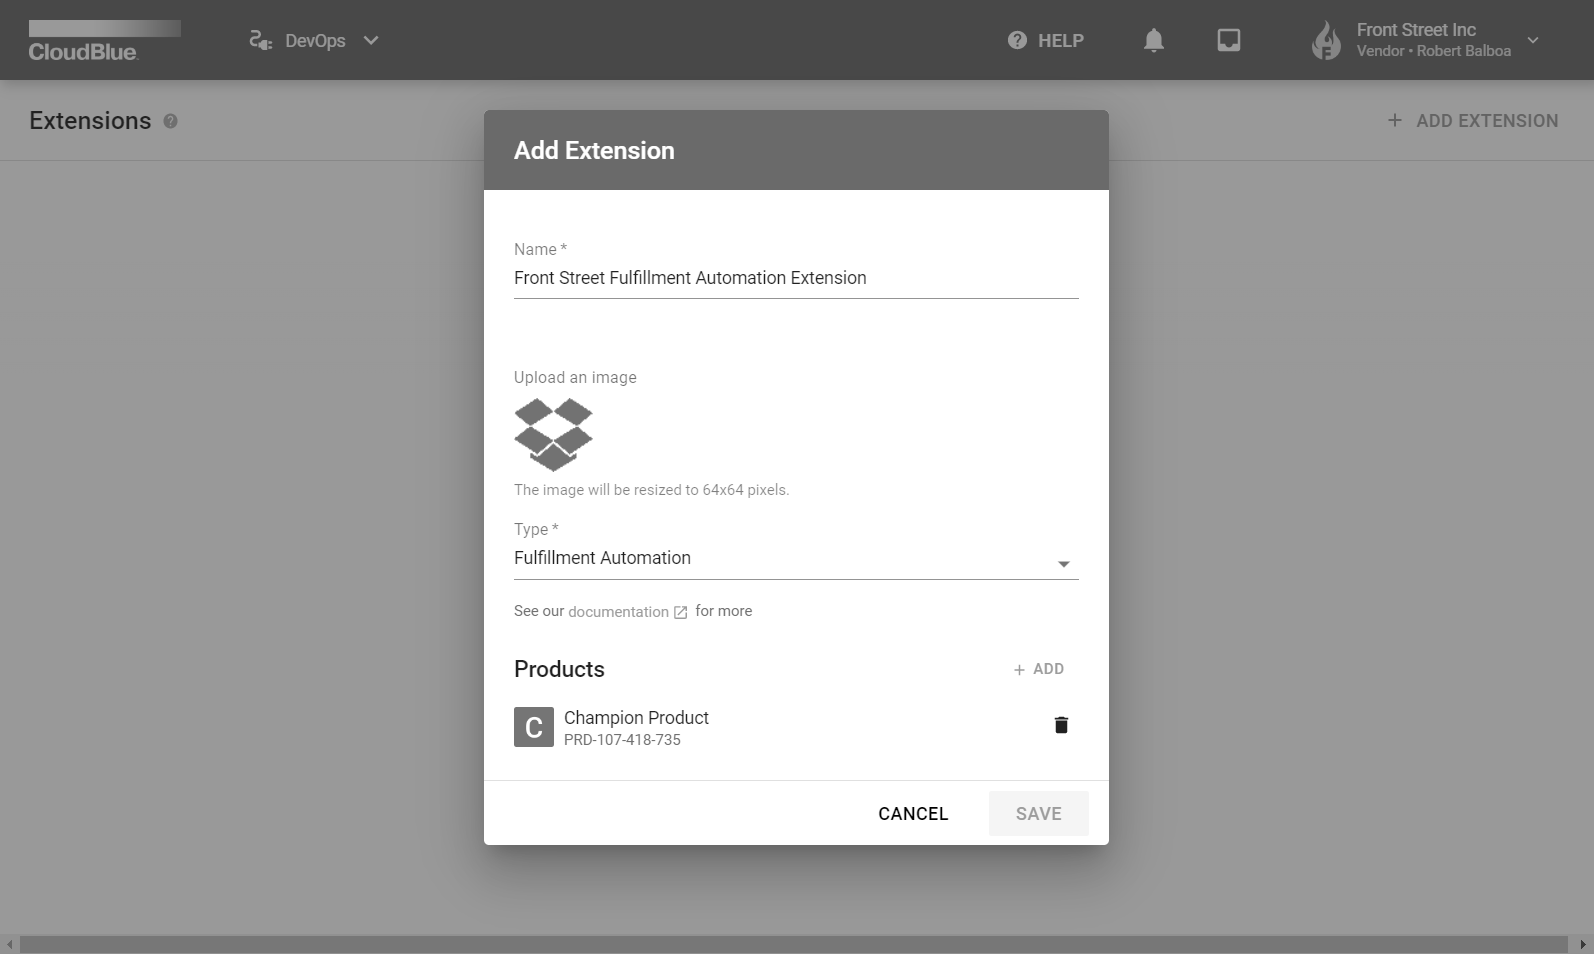
Before starting to deploy and configure with your extension, it is required to define an object for your extension on the Connect platform. Start creating a new extension by navigating to the DevOps module and clicking Add Extension.
The system provides the following configuration options that allow defining your extension project:
Name: Specify a name for your new extension object.
Upload an image: Provide an image for your extension project if necessary.
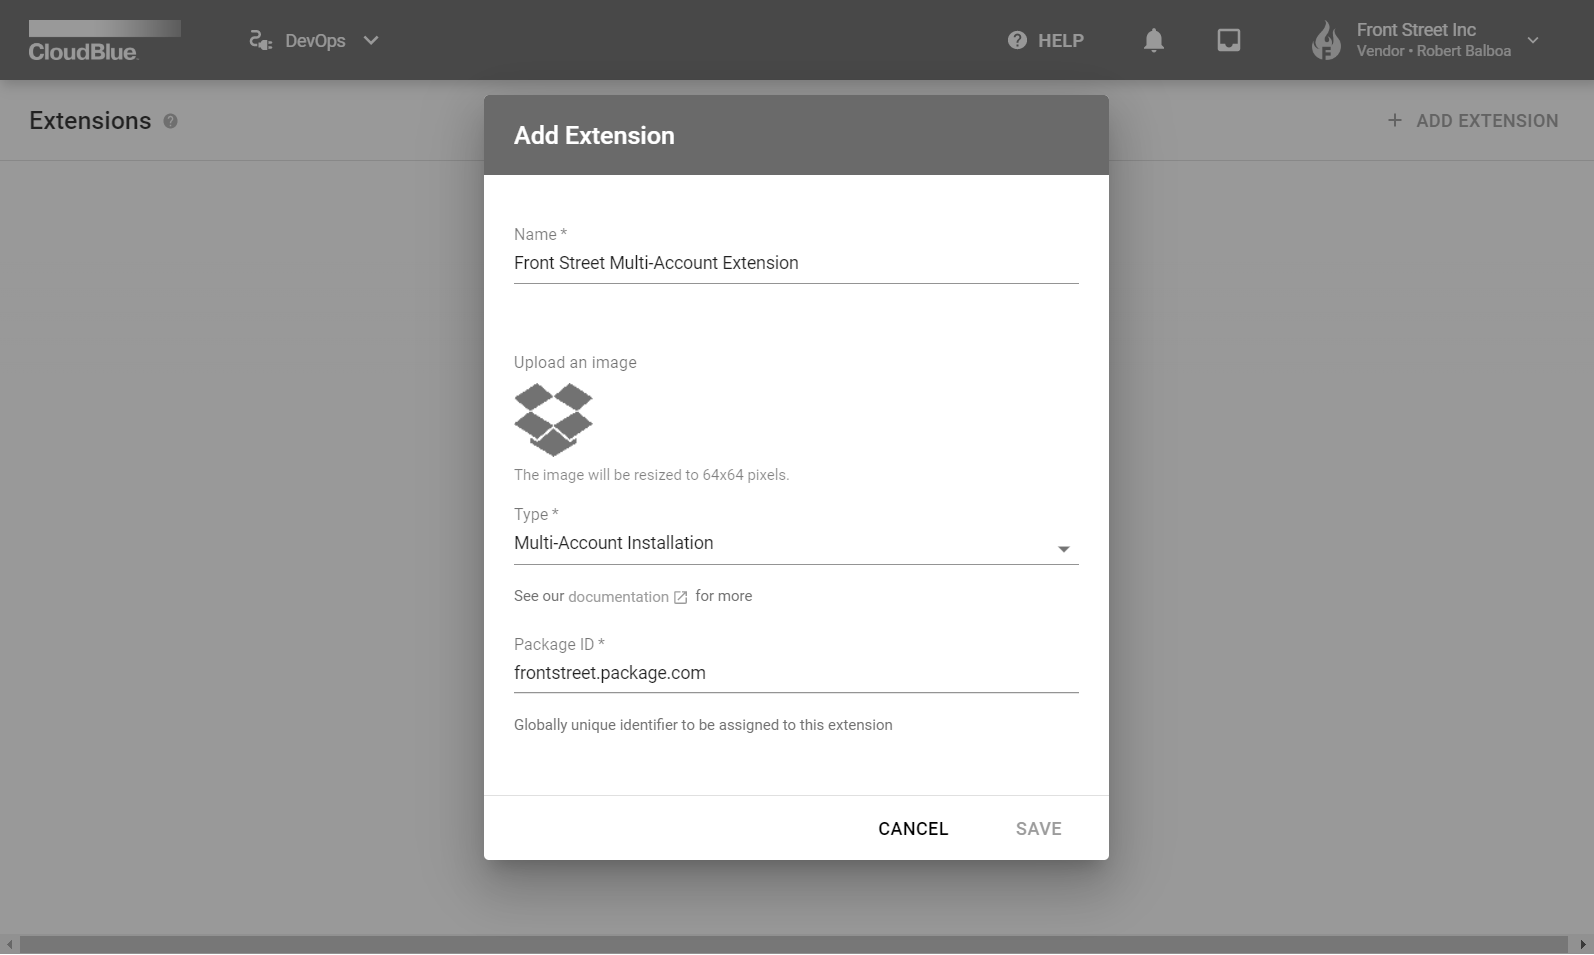
Type: The system requires to select one of the following extension types:
Multi-Account Installation: This extension type is used to create an extension to streamline or automate various business scenarios. Multi-accounts extensions will be available for your business partners and other organizations with your provided invites. The system also allows publishing such extensions for the public access.
Commerce Transformations: Use this type to create an extension for working with commerce systems. The commerce transformations type provides the same functionality as multi-account installation extensions.
Fulfillment Automation: This type is used to create an extension for automating the Fulfillment Request approvals. The system enables to specify products that will work with your extension. Note that this extension type is available only for Vendor accounts.
Hub Integration: Select this type to establish integration with your registered Hub on the Connect platform. The system requires to specify your package identifier in the following format: cloudblue.connect.package. This extension type is available only for Distributors and Resellers.
Click the Save button to finalize the initial setup for your extension object on the Connect platform. Continue configuring your extension as it is described in the Extension Project documentation.
Service Details
Once a new extension object is added to the DevOps module, the system allows accessing the Extension Details screen. It provides detailed information on your deployed service and enables to perform various operations with your extension.
Multi-Account Extension Management
If the multi-account extension type is selected and your service is deployed, the system allows managing each installation, generating invitations for your business partners, and perform other actions. For more information on the operations that are exclusive to this extension type, refer to the Multi-Account Service documentation.
The following describes the provided graphical user interface and showcases essential operations within the Extension Details screen:
In case it is required to change the name or image of your extension, click the Edit button at the top-right corner of the screen. In addition, the vertical ellipsis (⋮) button allows deleting extension on the Connect platform.
Removing Services and Switching Environments
Note that it is possible to delete an extension only in case all of your environments are stopped or disconnected. The system also allows to switch your environment mode (i.e., switching your local environment to the Cloud mode and vice versa) only in case this environment is stopped, uninitialized or disconnected.
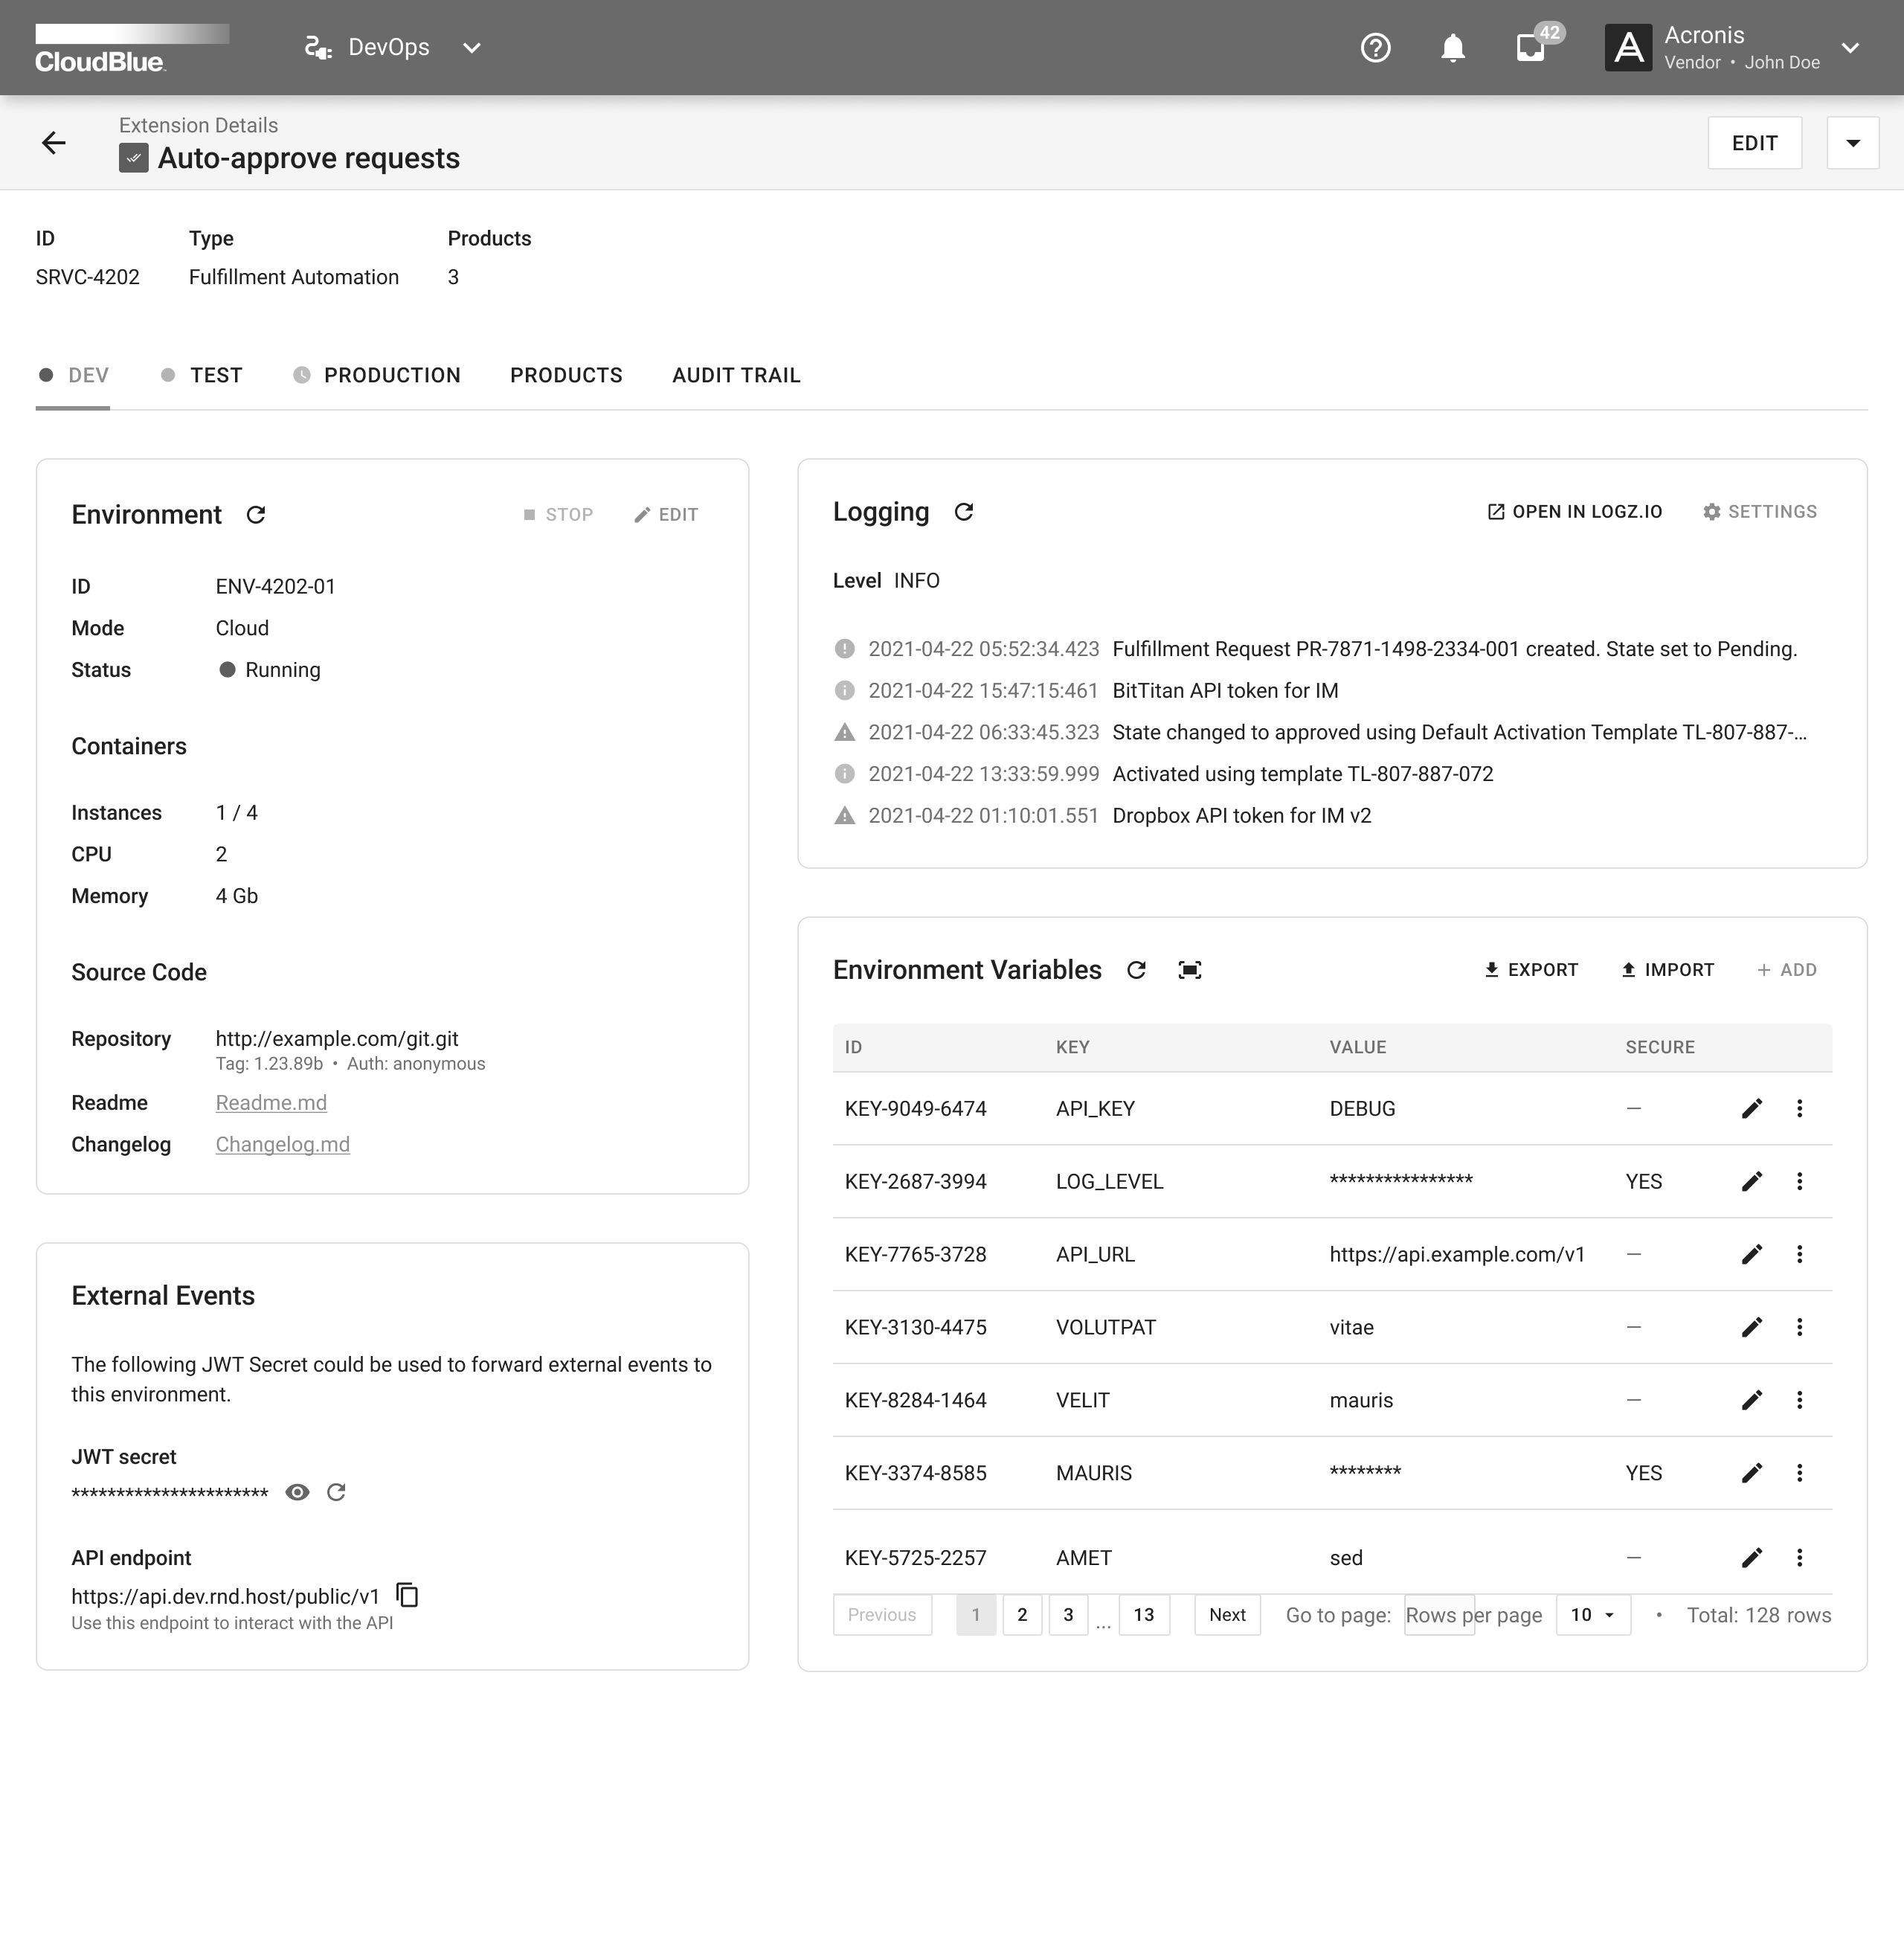
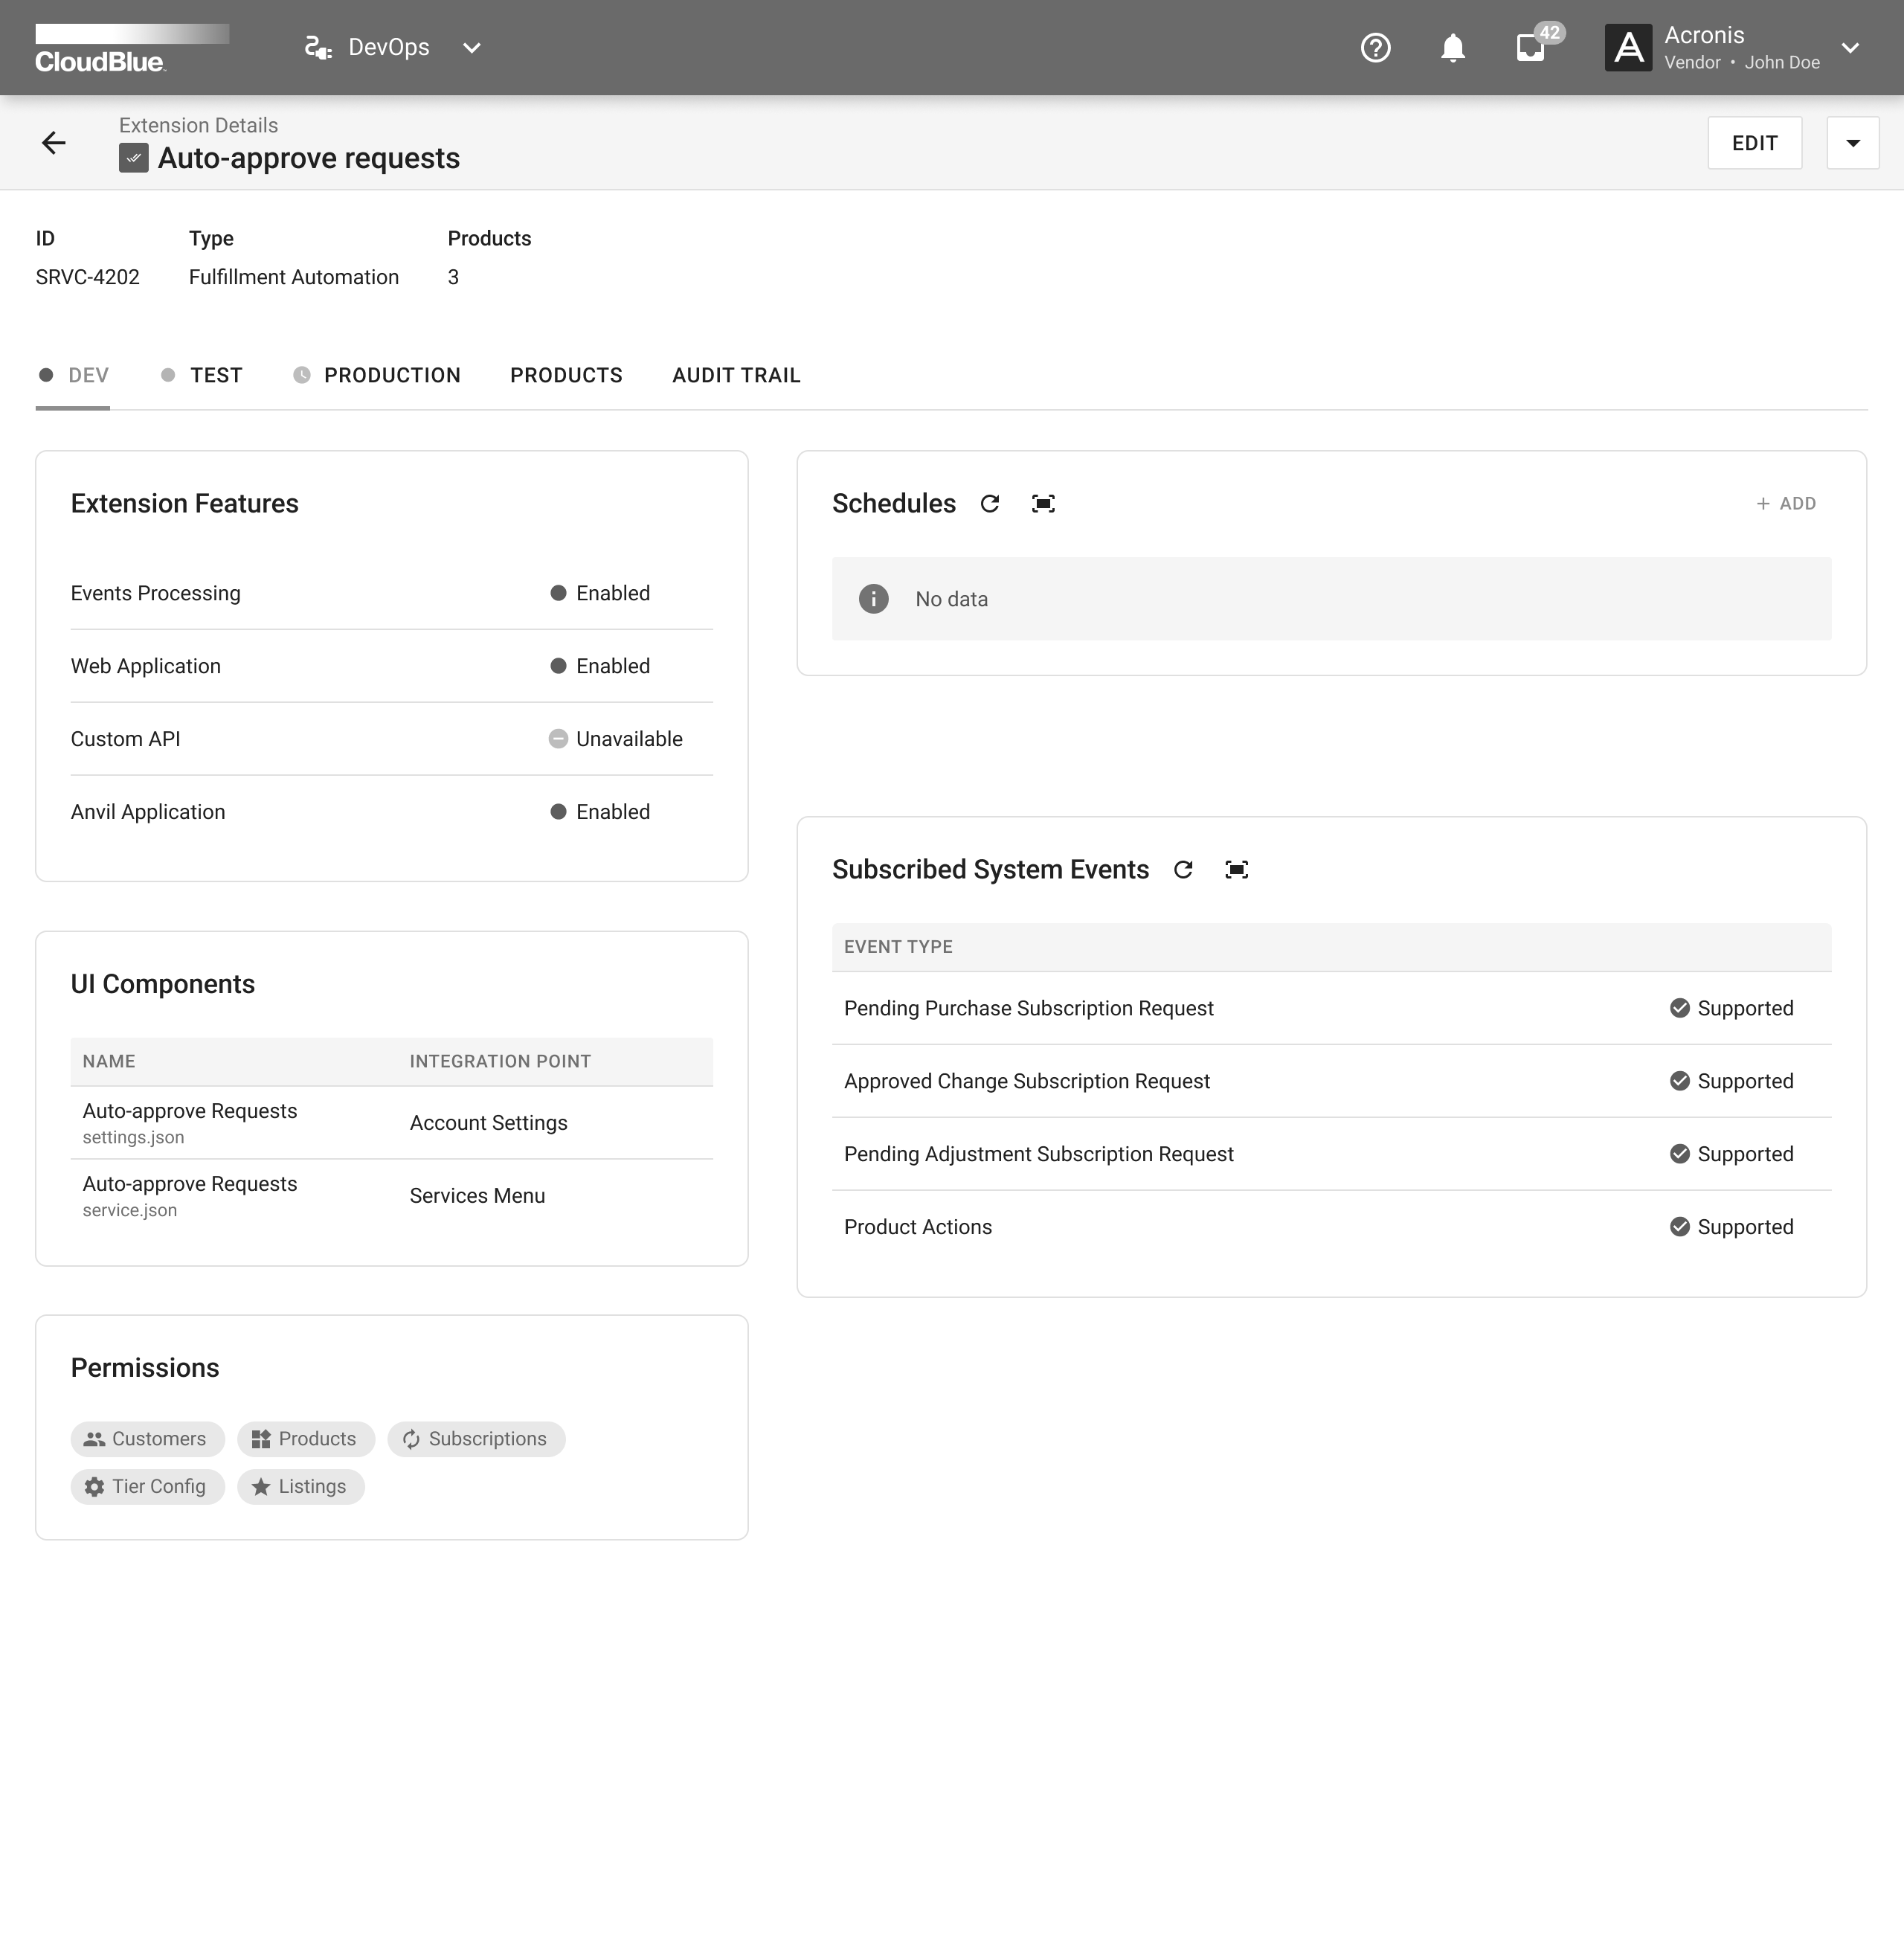
The Extension Details screen enables Connect users to access Developer (Dev), Production (Prod) and Staging (Test) environments via corresponding tabs on the user interface. The system provides the following sections within each tab:
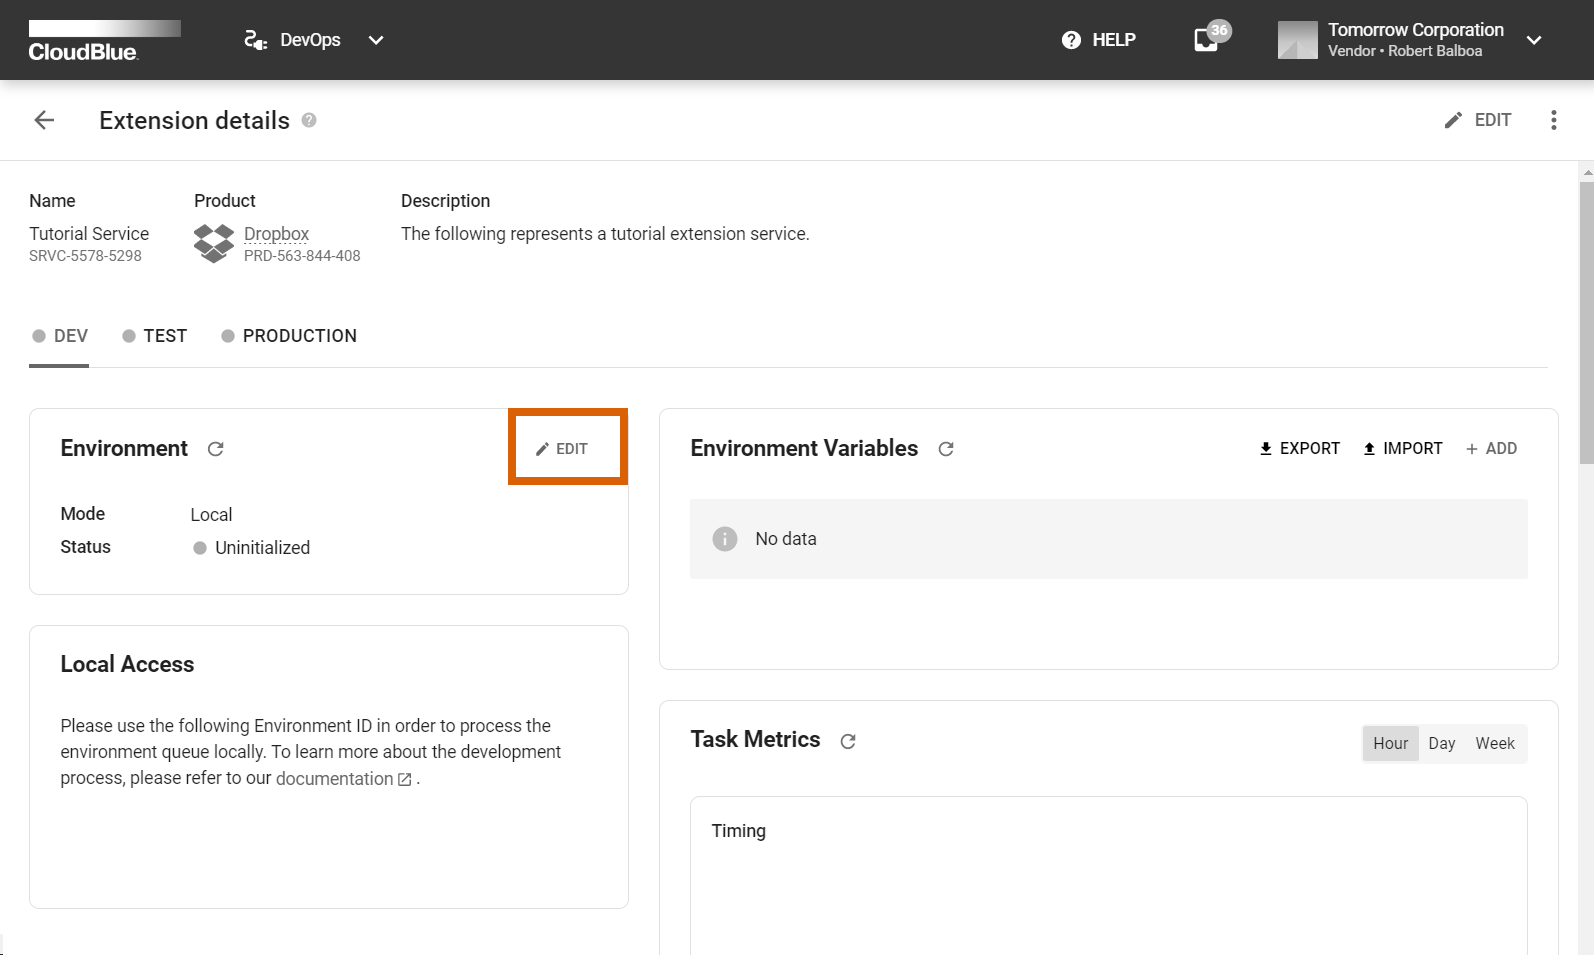
Environment: This section displays your environment mode (Local or Cloud) and its status (Deploying, Disconnected, Connected, Running, Stopped, or Errored). Enable or disable your environment by using corresponding buttons on the user interface. Click the Edit button to configure your environment as described below. In case the Cloud mode is connected, this section also displays your deployed container instances, CPUs and memory. Furthermore, this section also displays your specified Git repository and provides links to your readme and changelog files.
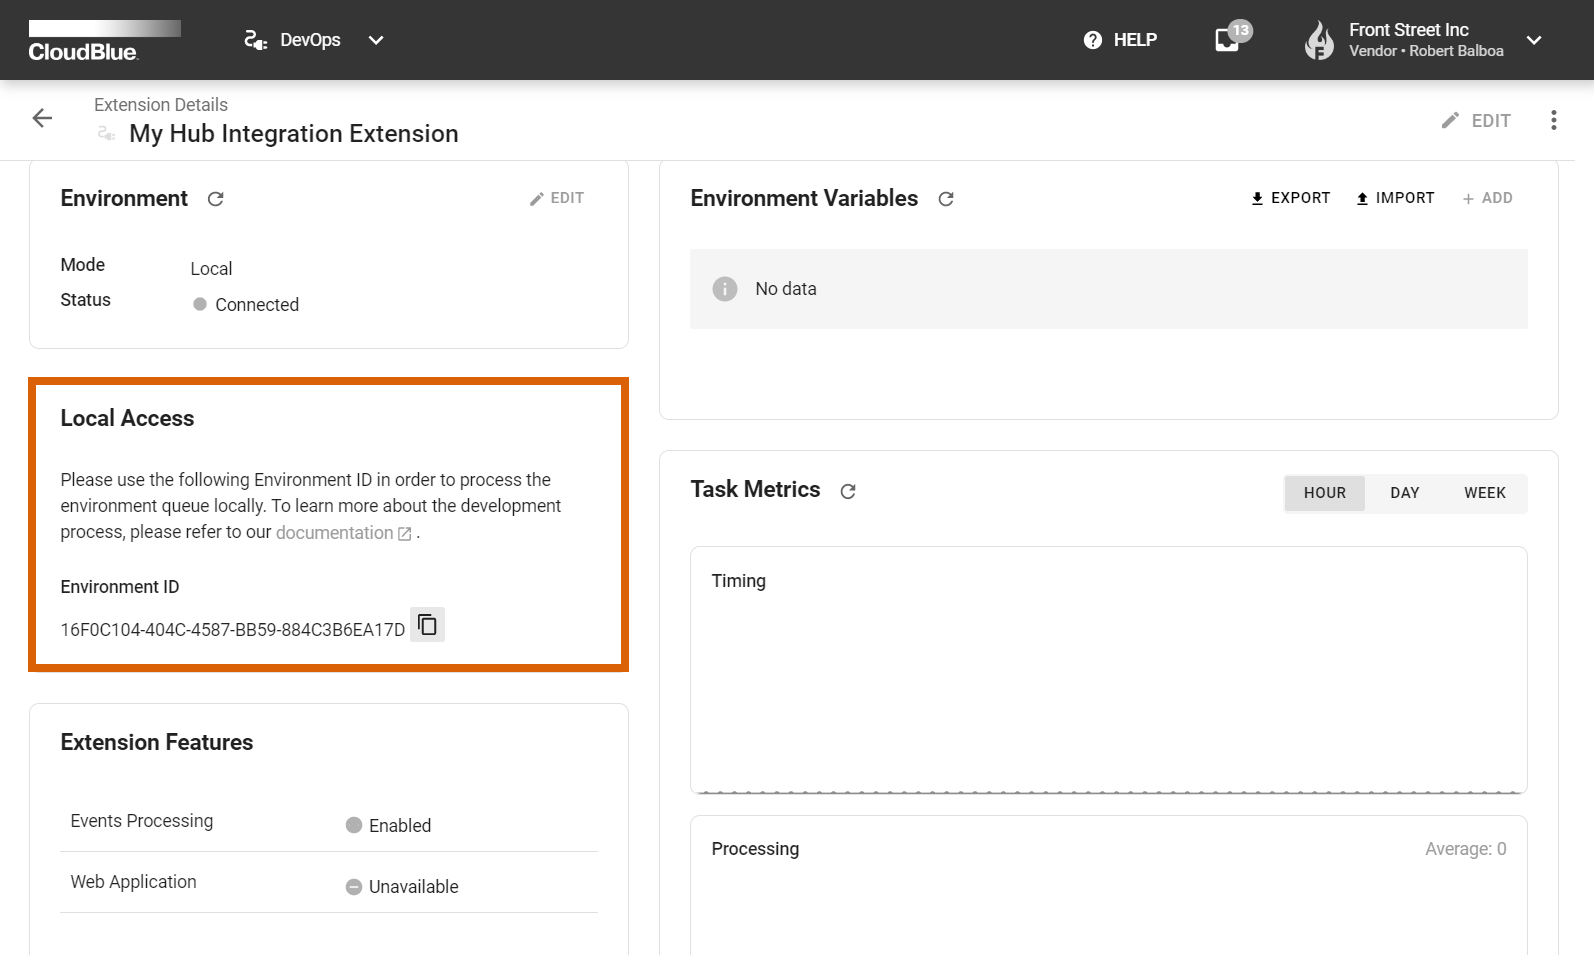
Local Access: This section is available in case the Local mode is selected. This section provides an Environment ID that is used to process your environment queue locally. Copy the link by using the corresponding icon from this section.
External Events: Provides a JWT secret that is required to forward external events to your selected environment. Show/hide or copy your JWT secret by using corresponding icons within this section.
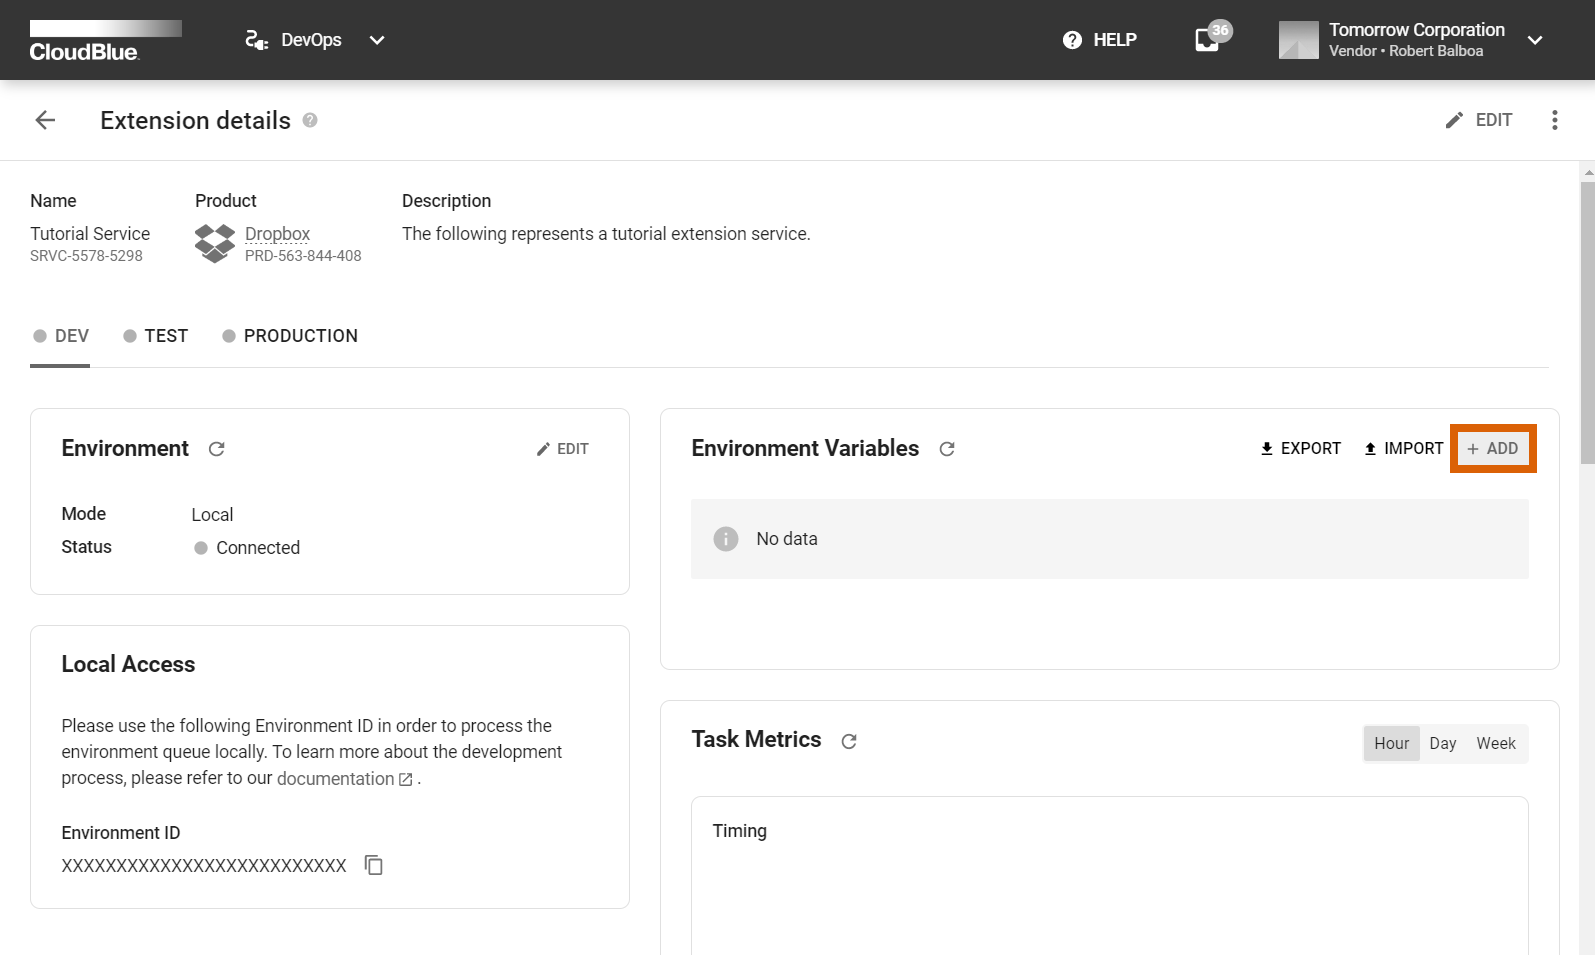
Environment Variables: Specify your environment variables with this section. Click the Add button to define a new value for your required variable. In addition, import or export your variables list by using corresponding buttons in this section. Click on the edit icon to change a variable from the list. Delete your variable by clicking on the vertical ellipsis (⋮) icon.
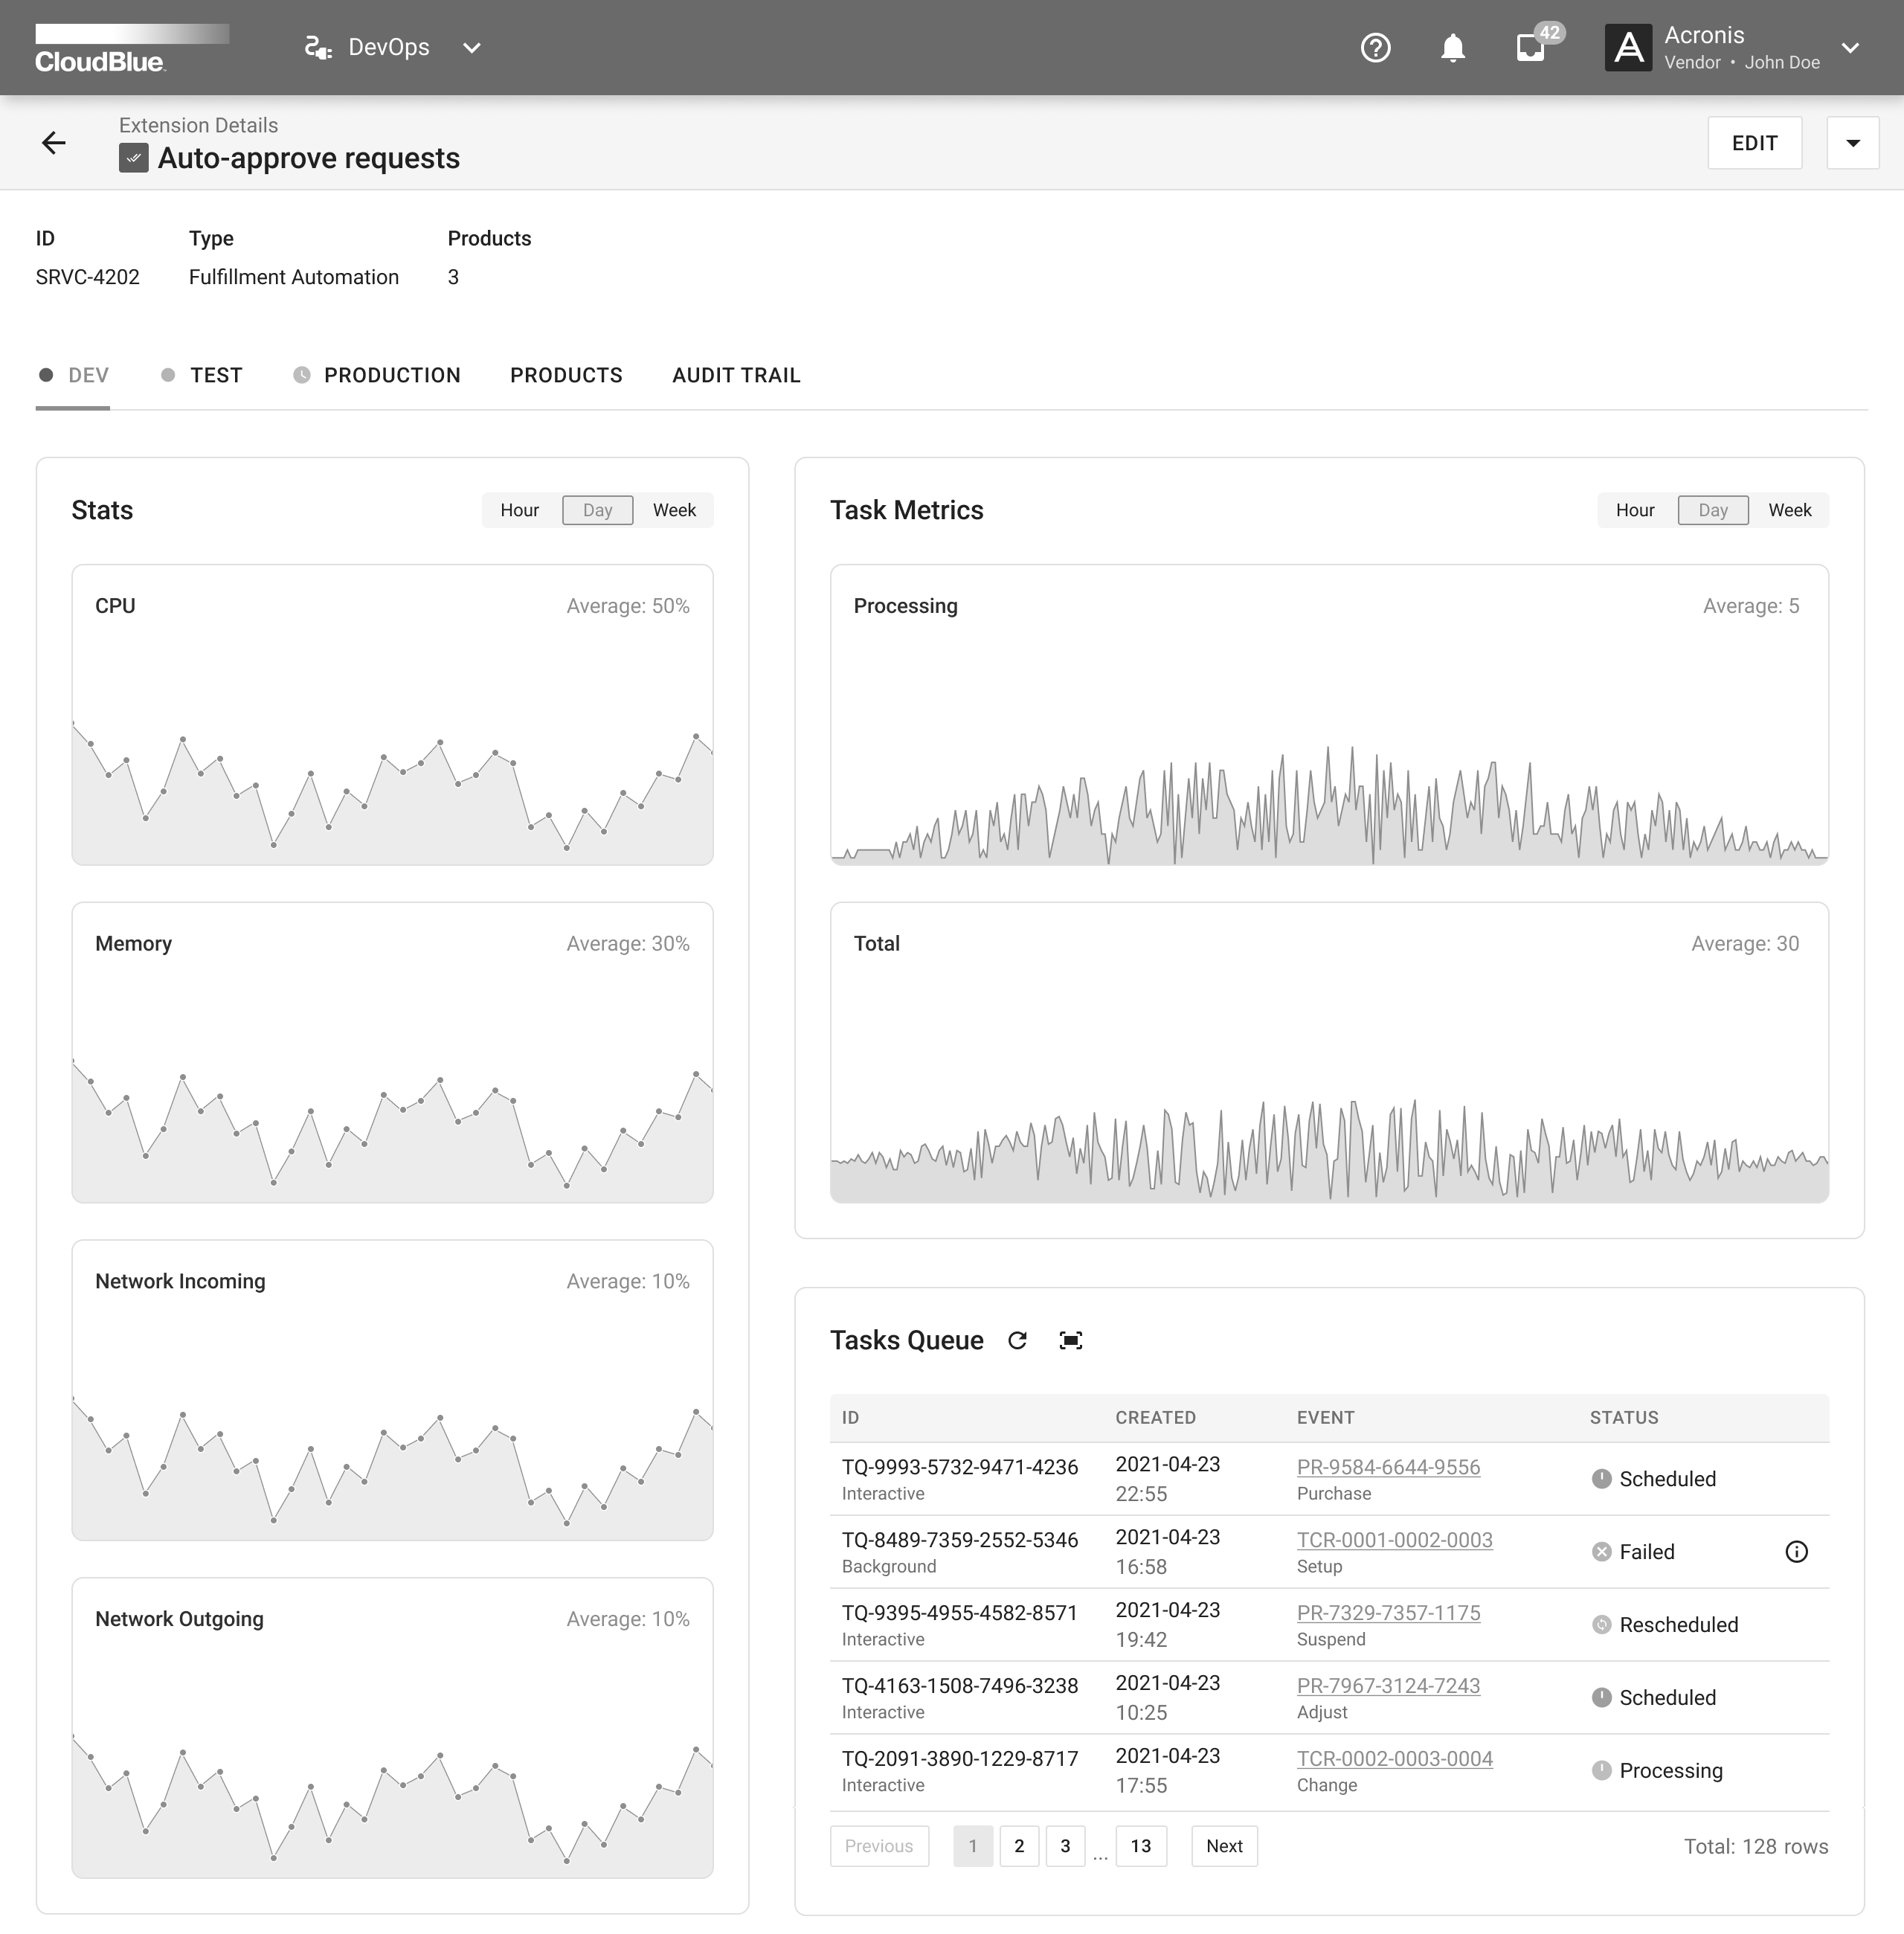
Tasks Queue: Use this section to examine tasks queue for your environment. For example, this queue may include pending fulfillment requests or tier configuration request that should be processed by Vendors systems. Note that in addition to processing tasks queue instances, the DevOps module allows you to schedule and reschedule your tasks.
Permissions: Provides required permissions to access associated modules on the CloudBlue Connect® platform. Namely, the system displays modules that can be accessed by your extension.
Once your extension is deployed successfully, the Extension Details screen also displays the following information within your connected or running environment tabs:
Stats: This section provides resource monitors that shows your CPU, Memory and Network utilization. Switch between your hour, day and week statistics by using the corresponding buttons in this section.
Events: Use this section to review event logs of your selected environments in the Cloud mode. Note that the system uses the logz.io extension with a Kibana UI to generate your event logs, create alerts, and more.
UI Components: Displays associated user interface components and their integration point. For instance, this may include auto-approve request components for your fulfillment automation extension.
Subscribed System Events: Provides system events on the Connect platform. Specifically, this section displays event types and whether each type is supported by your extension.
Extension Features: Review features that are enabled for your extension. The system specifies whether your extension includes event processing, web application, custom API methods, and the Anvil.Works application functionality.
Custom API Methods: This represents a list of custom API methods that are provided by your extensions and that can be used once the extension is installed. It also includes an endpoint to interact with the API.
Schedules: Used to schedule the processing of your extension tasks. Detailed information on how to configure and manage your schedules is available under the corresponding heading in this article.
Environment Configuration
The system allows switching your environment between the Local and Cloud modes in case your environment is not running or connected.
Access the Extension Details screen and click the Edit button next to your environment mode and status information to start configuring your selected environment.
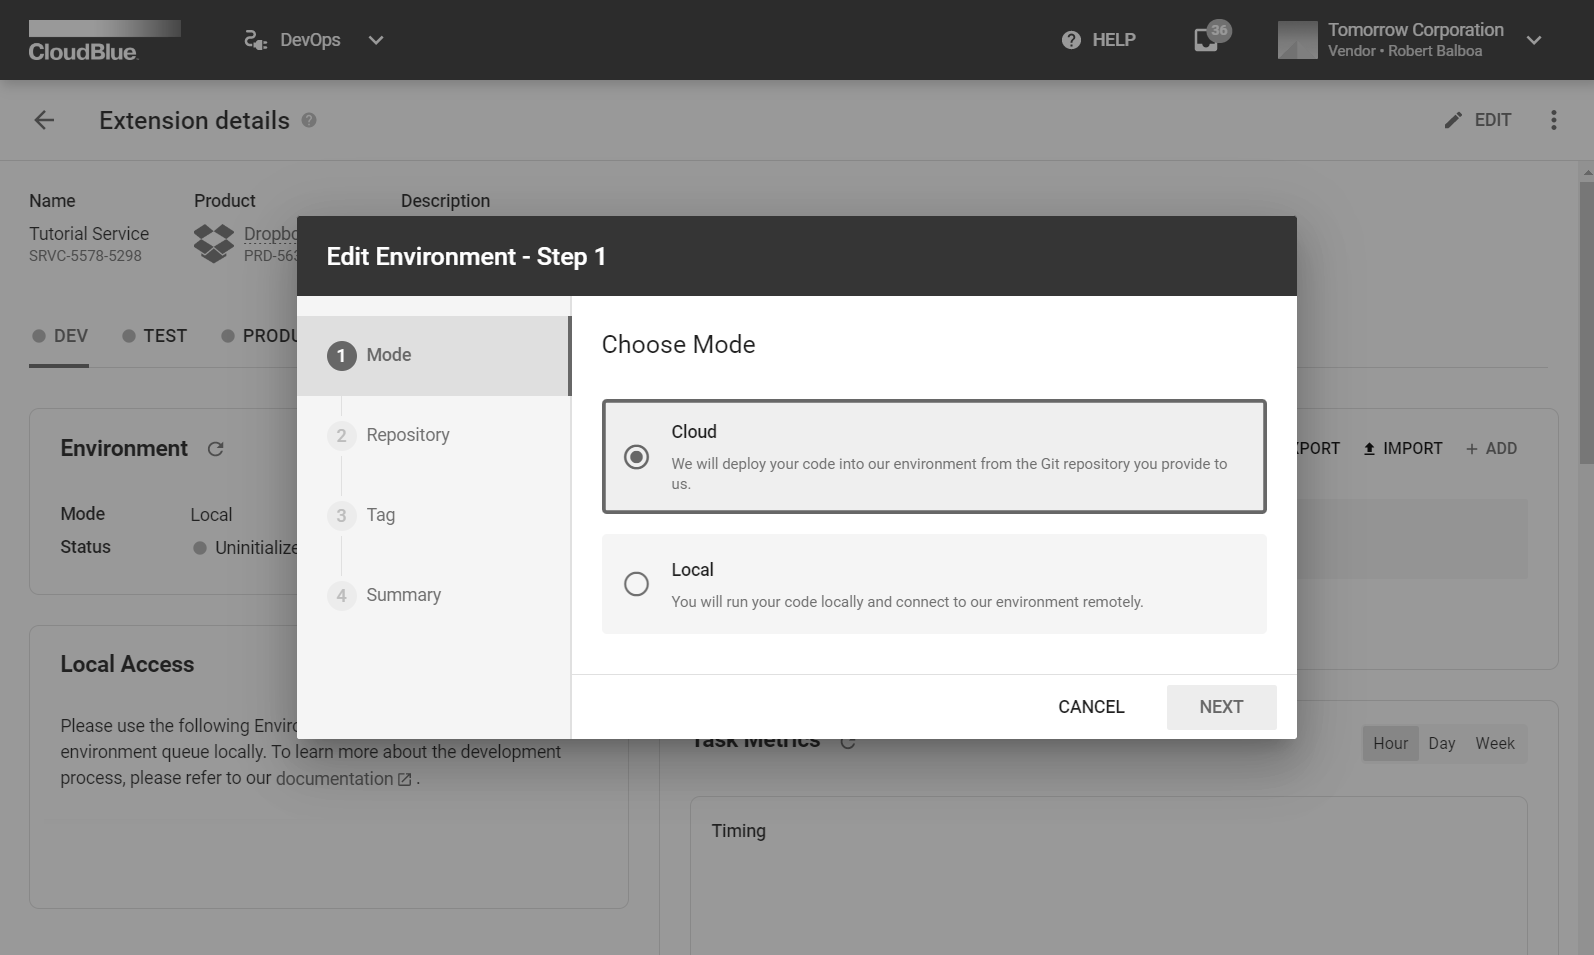
Therefore, the system provides a wizard that helps users with the following configuration:
Mode: Select the Cloud mode to deploy your extension on the Connect-managed infrastructure. Choose the Local mode to deploy your environment on your custom infrastructure.
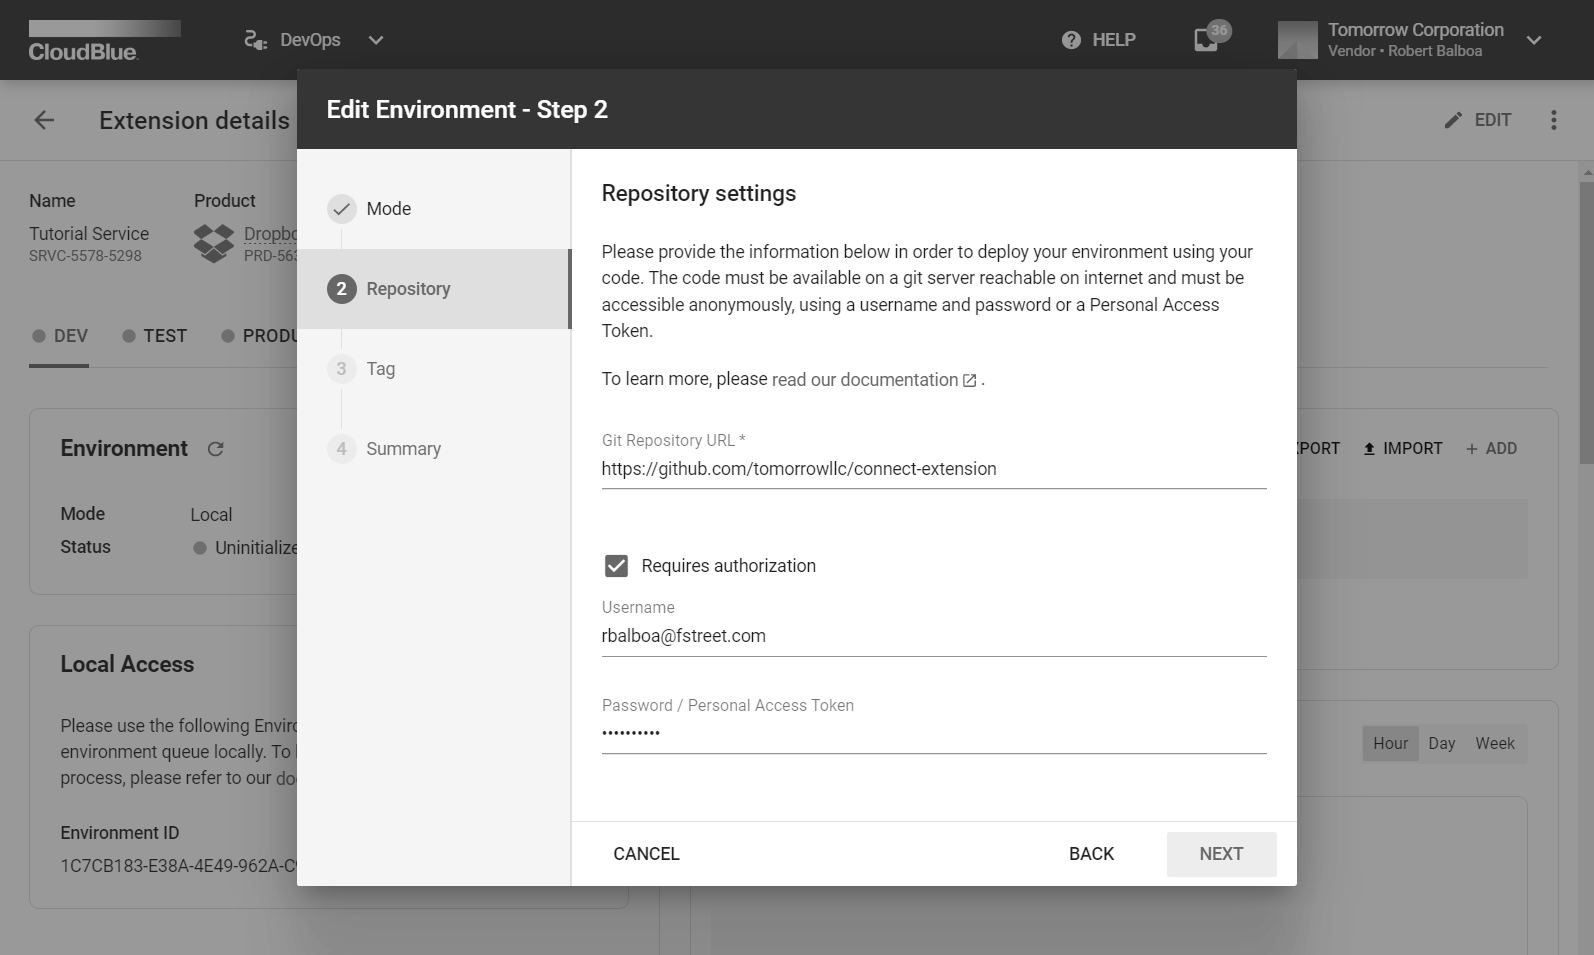
Repository: Specify your Cloud repository and authorization details in the following form. Note that this wizard step is available only in case the Cloud mode is selected:
Git Repository URL: Provide a link to your Git repository.
Requires authorization: Check this checkbox in case your repository requires authorization.
Username: Enter your Git username if authorization is required.
Password: Specify your password in case authorization is required.
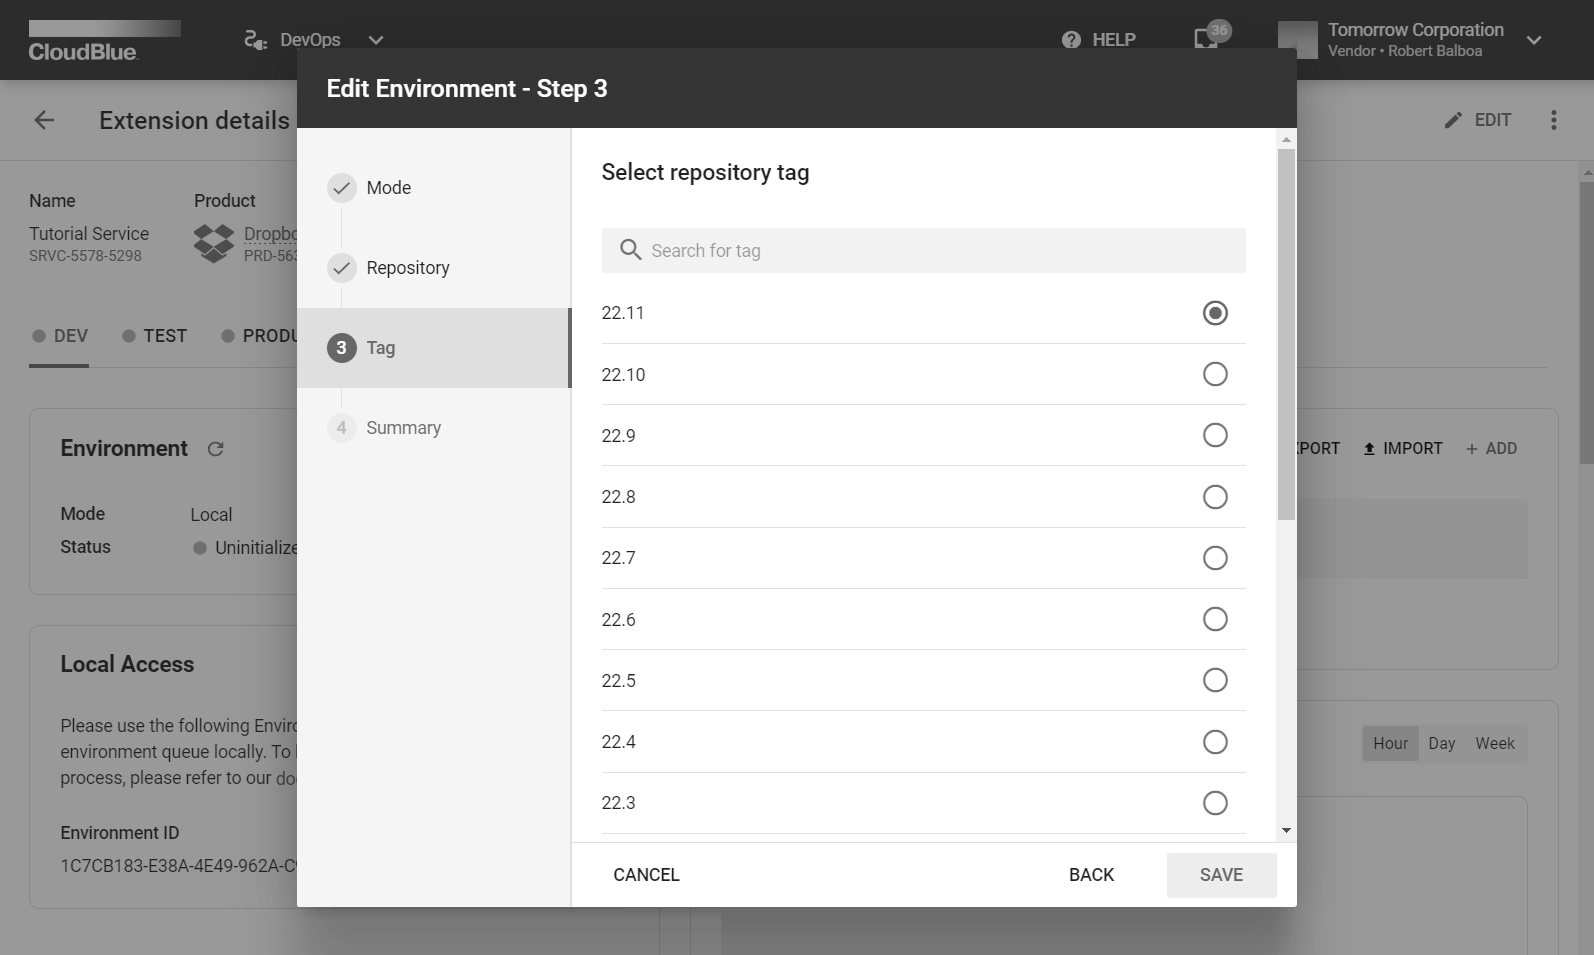
Tag: Specify your repository tag in the following form. This wizard step is available only in case the Cloud mode is selected.
As a result, the system provides an environment configuration summary. Make sure that your provided summary is correct and click the Close button.
Environment ID Specification
In case your service should be deployed locally, the system provides access details that are unique for each of your local environments and that are used to bootstrap your extension project. Specifically, it is required to copy your Environment ID and enter this identifier while providing environment configuration for your extension. Access your instance identifier as described below:
Navigate to the environment that is necessary for bootstrapping extension project. Locate the required identifier under Local Access details. Use the provided button to copy your identifier.
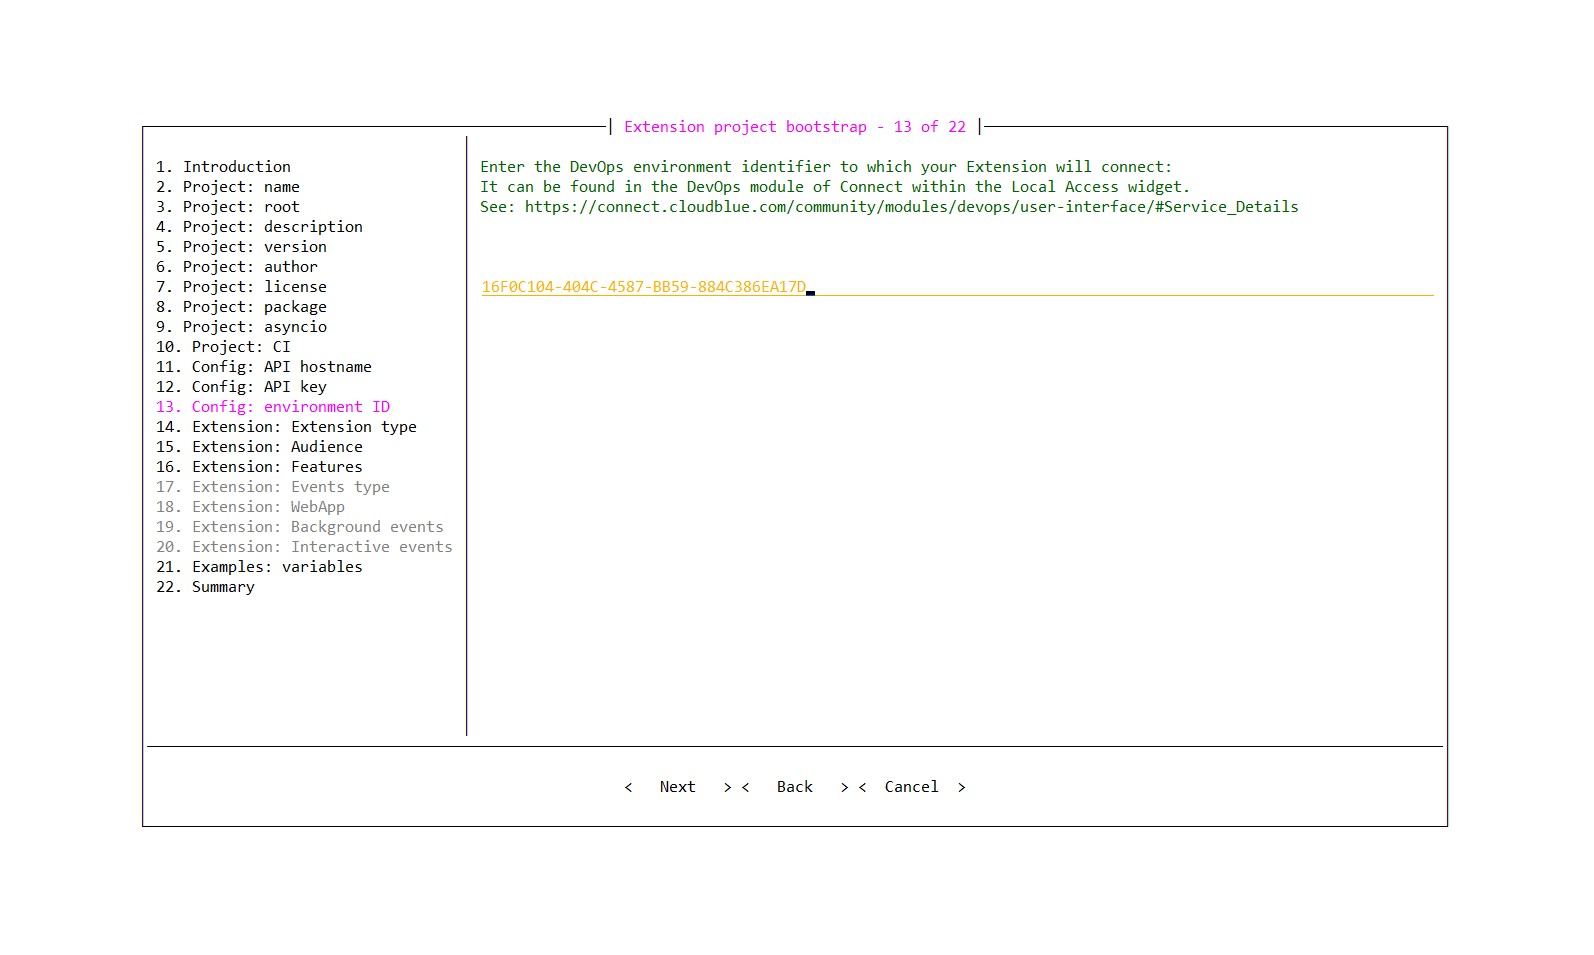
Once you start bootstrapping your extension project, paste your identifier on the Config: Environment ID step.
Consequently, the Connect CLI will use your provided identifier for the subsequent configuration. For more information on the extension project creation, refer to the Extension Project documentation.
Environment Variables
Environment variables are essential for working with your extension. Such variables directly affect the way running processes will behave on your configured environment. Note that environment variables store parameter keys and their values, which then served as input to your provided service. Follow the guidelines below to add, import, and export your environment variables.
Adding Variables
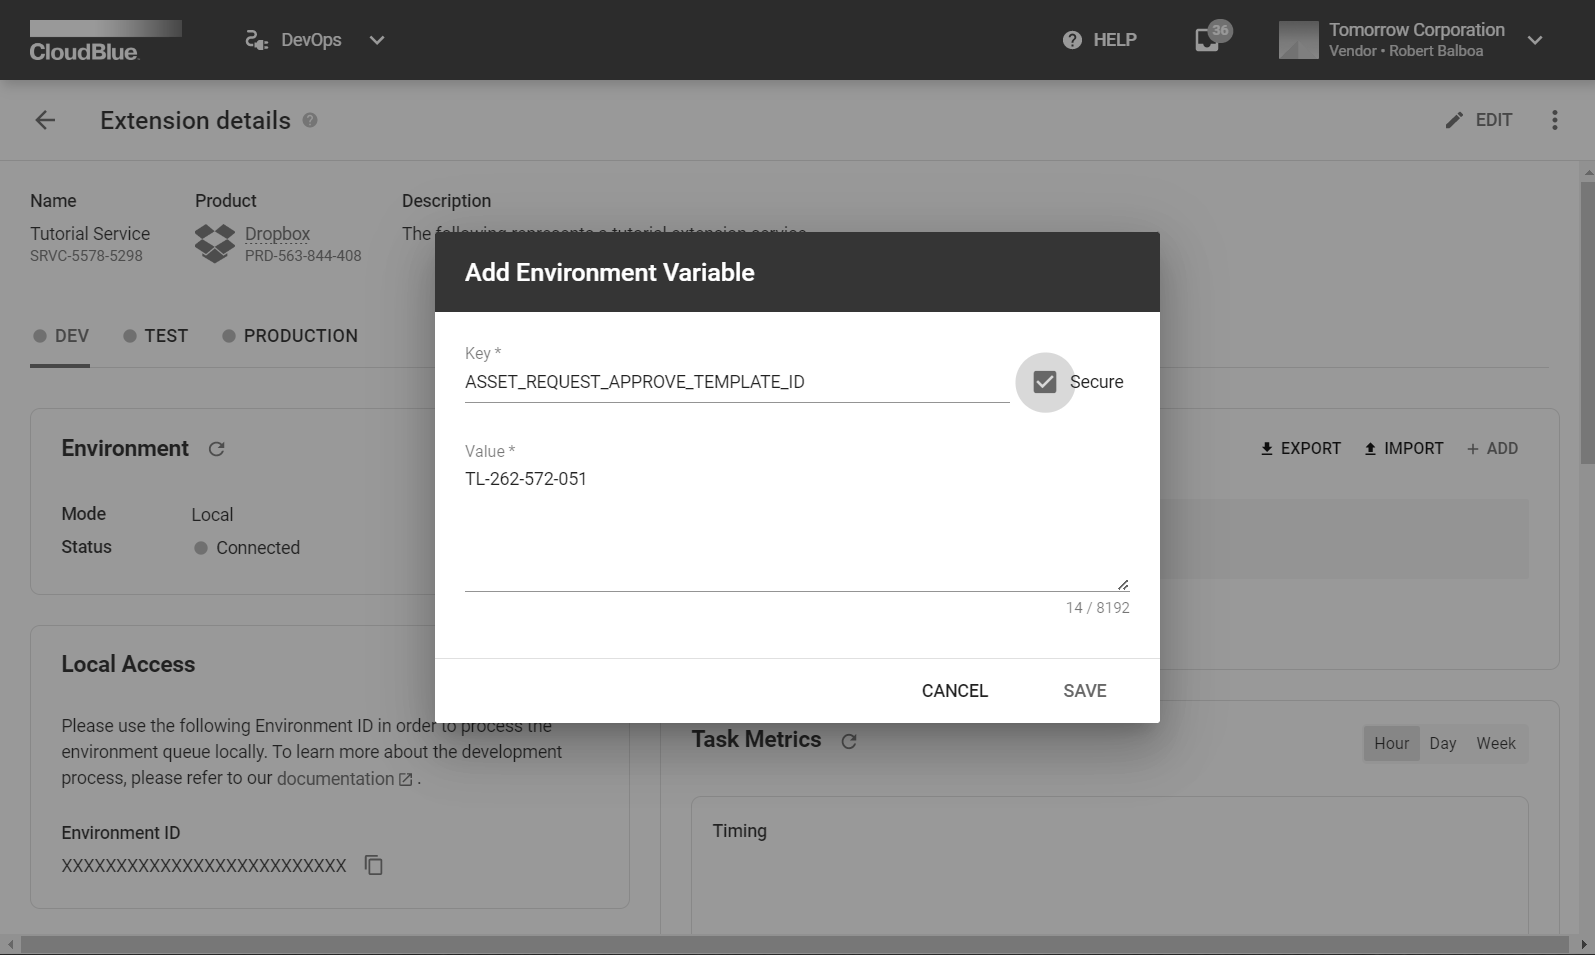
Access the Extension Details screen and click the Add button under Environment Variables to define a new value for your environment variable:
Provide your environment variable key (e.g., ASSET_REQUEST_APPROVE_TEMPLATE_ID).
Specify a value for your new key (e.g., activation template value: TL-262-572-051).
In case the Secured checkbox is checked, the provided value will be encrypted. Thus, this value can be used only by your extension project.
Add your new variable by using the Save button.
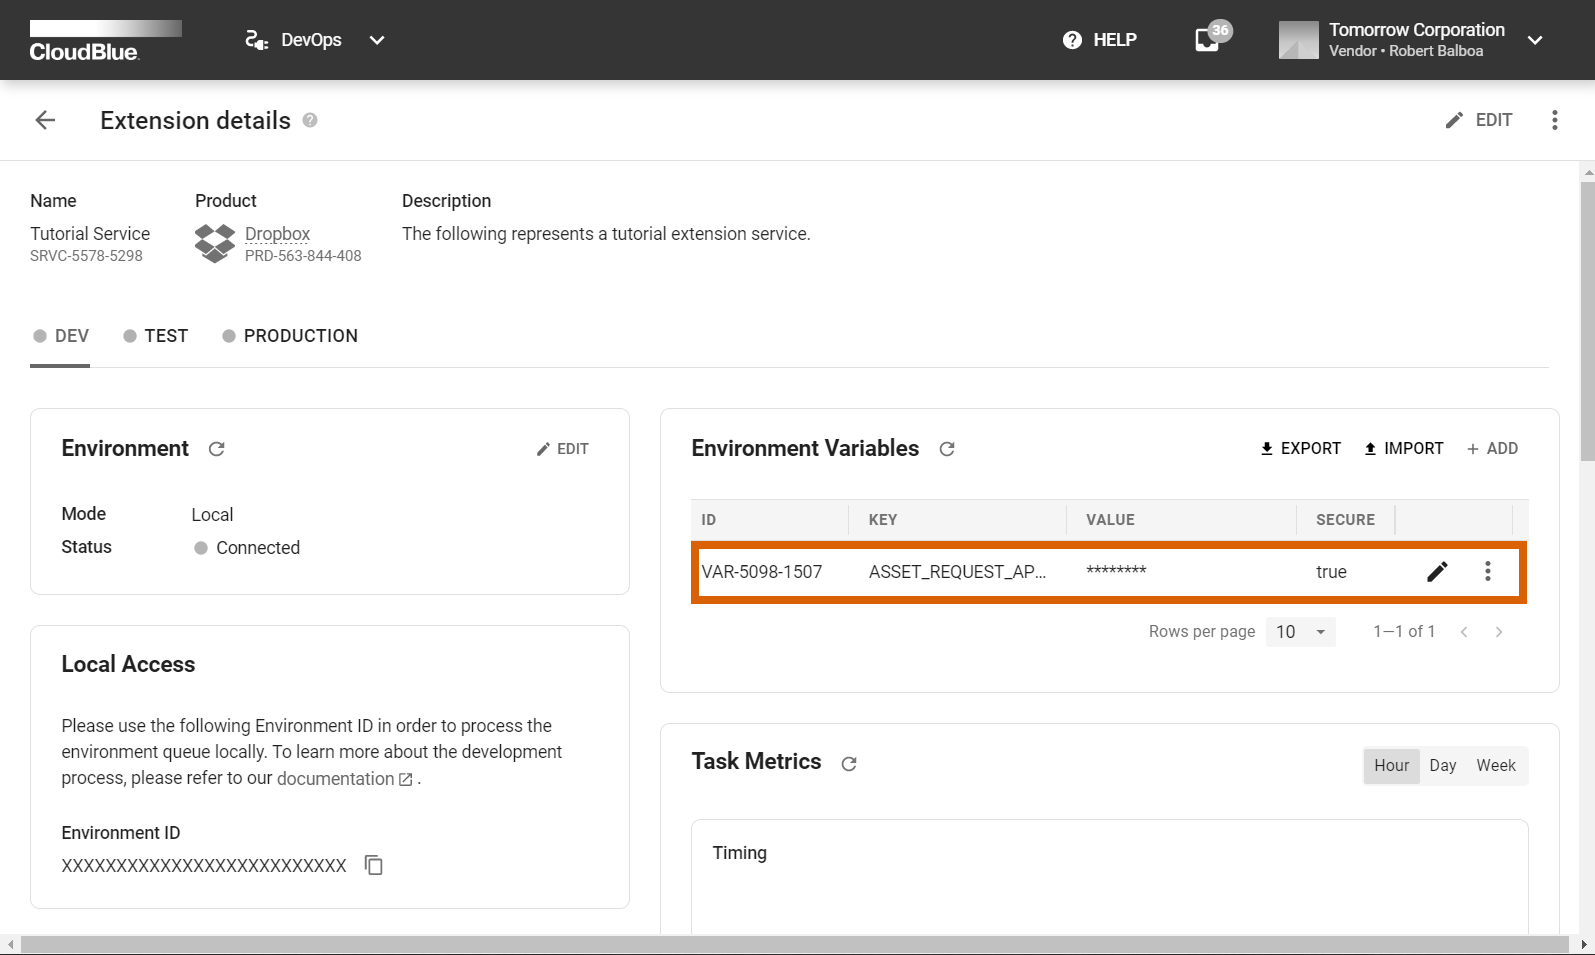
Once your environment variable is added, the system allows managing your variables by clicking on the edit icon. Note that in case your variable is secured, the system only allows changing your specified value. Your variable can also be removed by using the additional (⋮) menu.
Import Operation
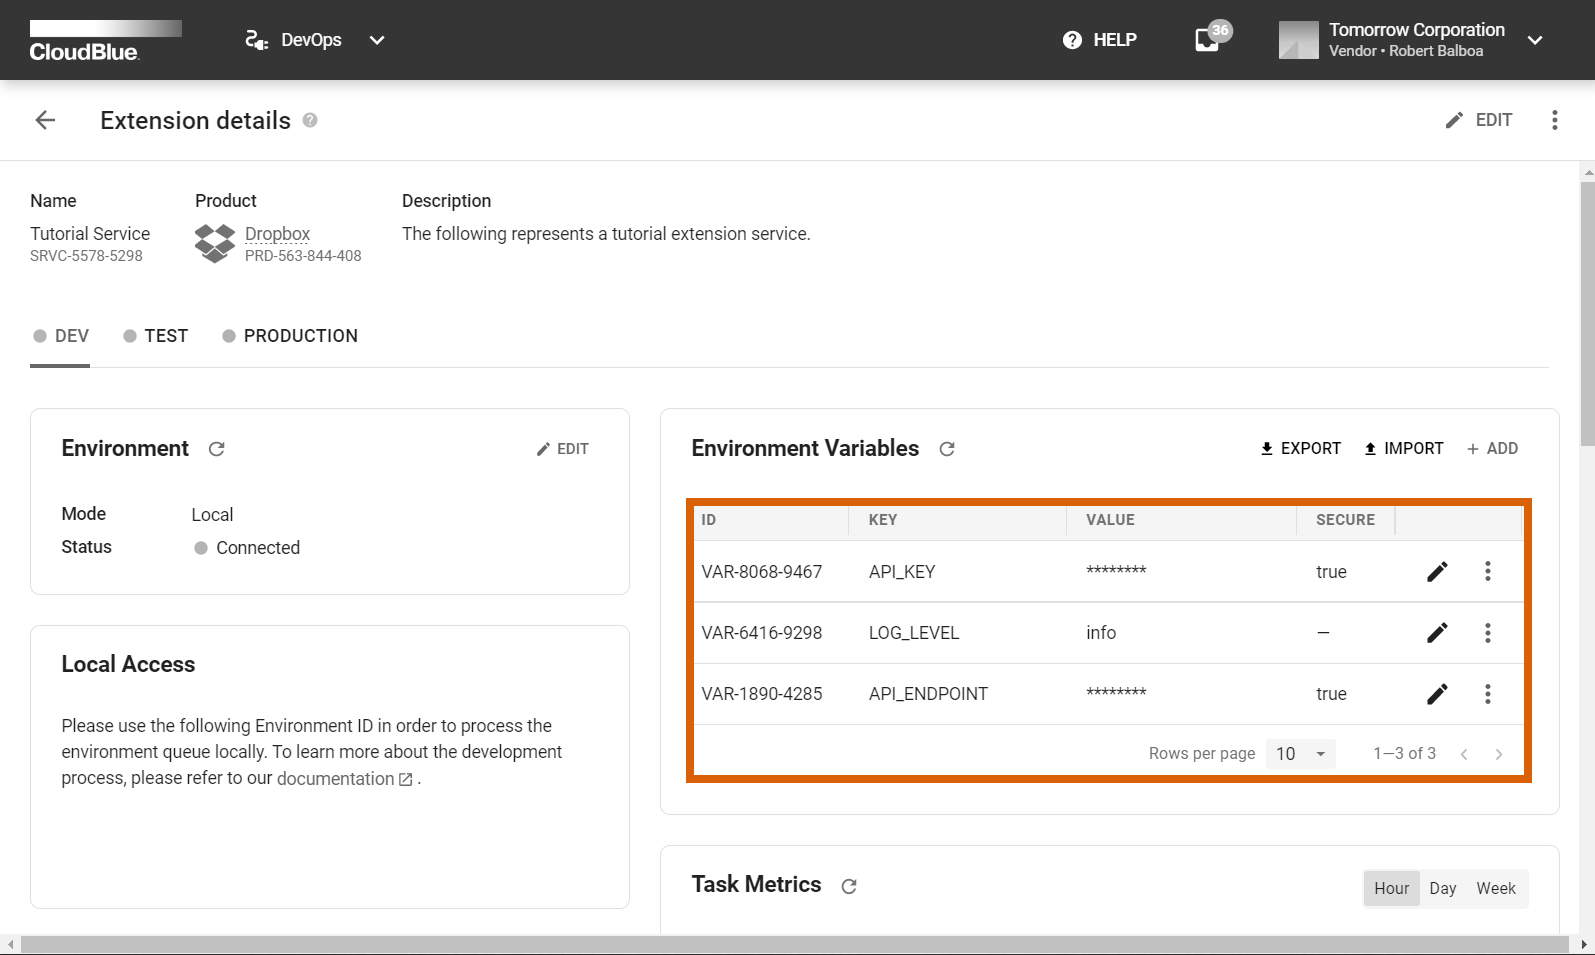
The Connect platform allows importing your environment variables that are listed in the spreadsheet table. Create a XLSX file and name your sheet as Data. Next, enter your variable name in the first column. The second column should include your environment value. Furthermore, the third column must specify if your environment should be encrypted (yes) or not secured (no).
Note that the first row serves as the headers for your columns and thus the first row should contains the following text: name, value and secure. The images below provide an example of a filled spreadsheet file and illustrate the successful import operation to the Connect platform:
Once your spreadsheet file is filled and ready for the import operation, access the Extension Details screen on Connect and click the Import button. Thereafter, browse your spreadsheet file or drag and drop this file to the following File Upload form.
In case the import operation is successful, click Save to finalize this operation. In case of an error, the system will provide detailed information on the issues with your spreadsheet file.
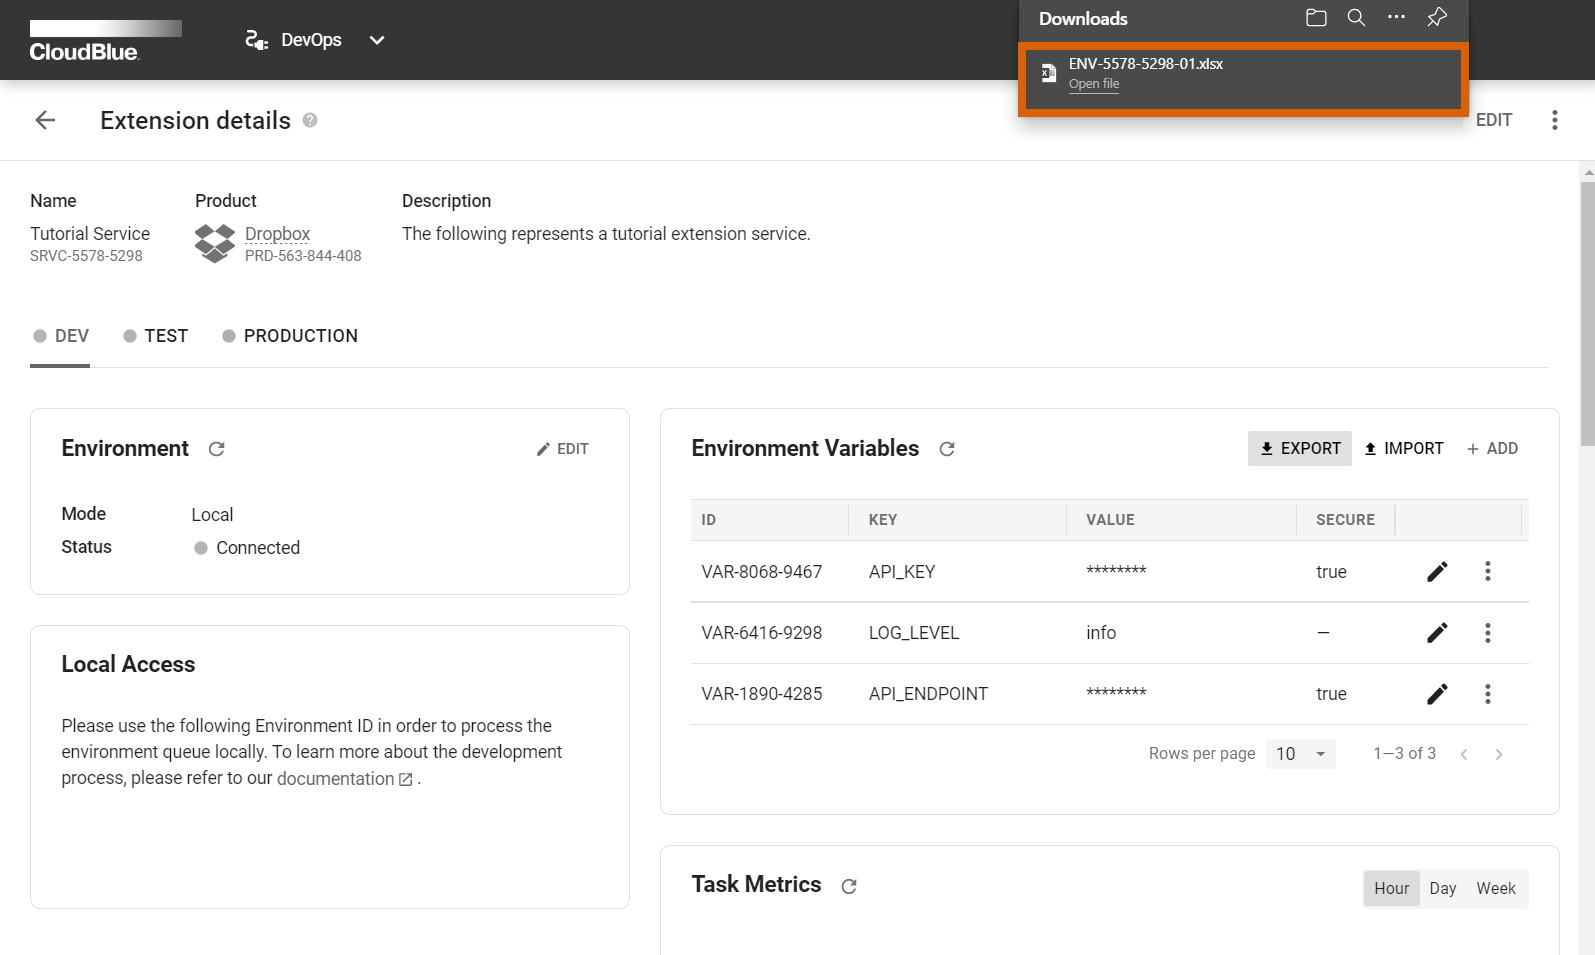
Export Operation
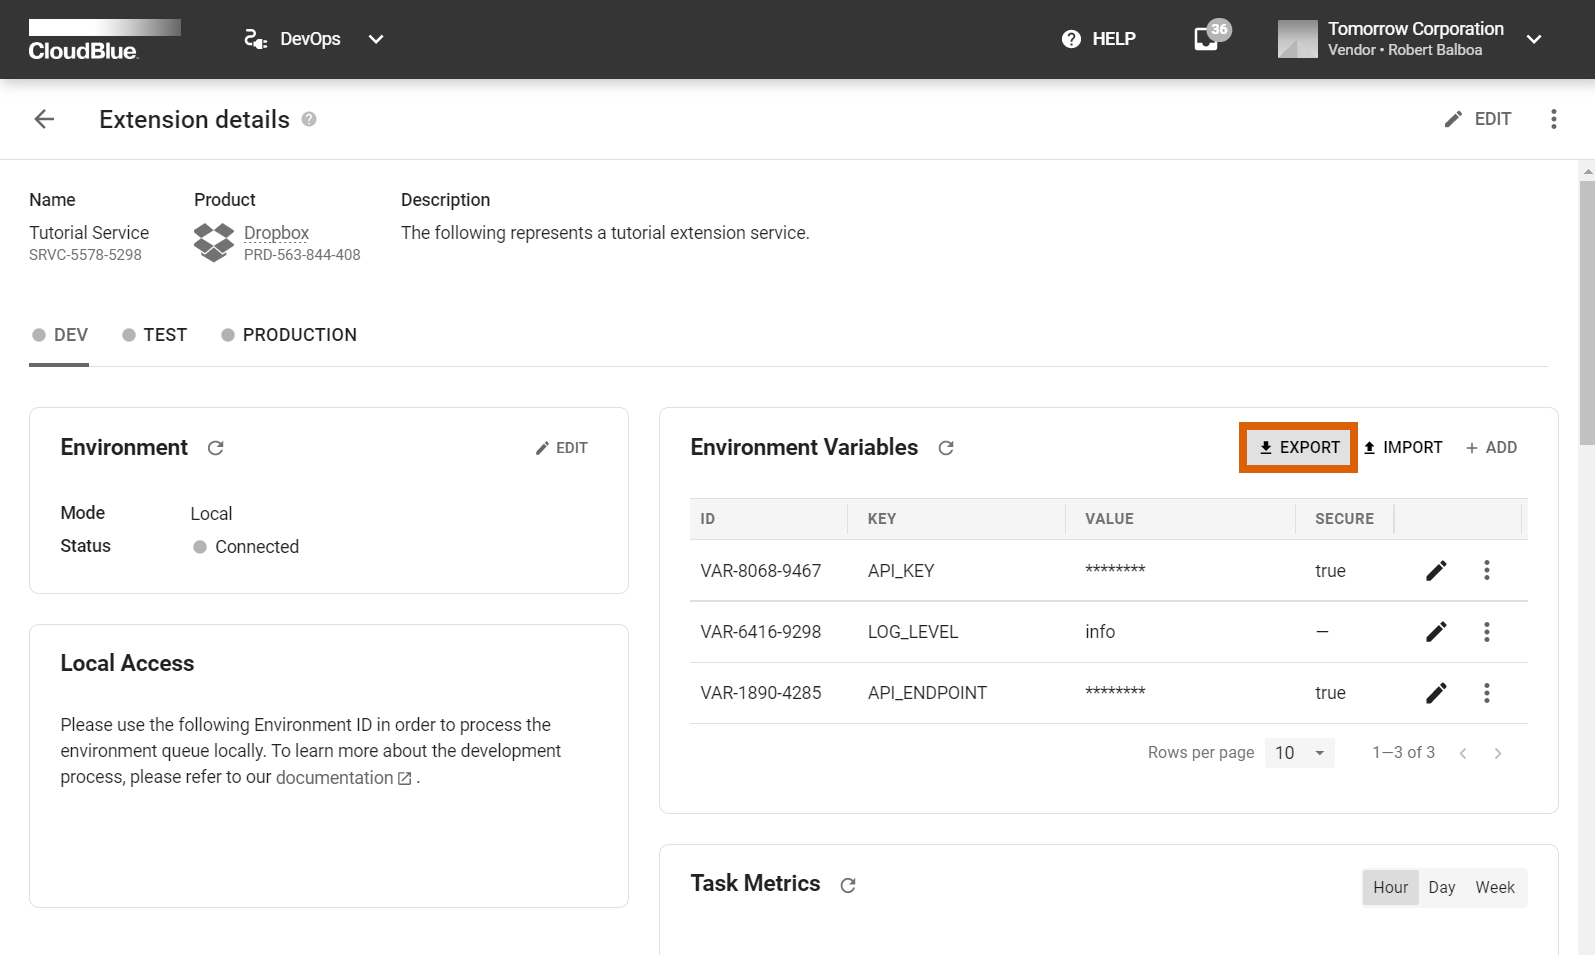
The system also allows exporting your variables that are specified within your particular environment. Therefore, the export operation can be essential to transfer your environment variables from one environment to another or to copy your variables to another extension instance on Connect.
Click the Import button to initiate this operation. Therefore, the exported spreadsheet file will be available in your browser’s download directory.
Your exported spreadsheet file provides the required environment variables and their values within the Data sheet. This file also provides general information, such as your account name and identifier, associated extension, environment, product, and export date.
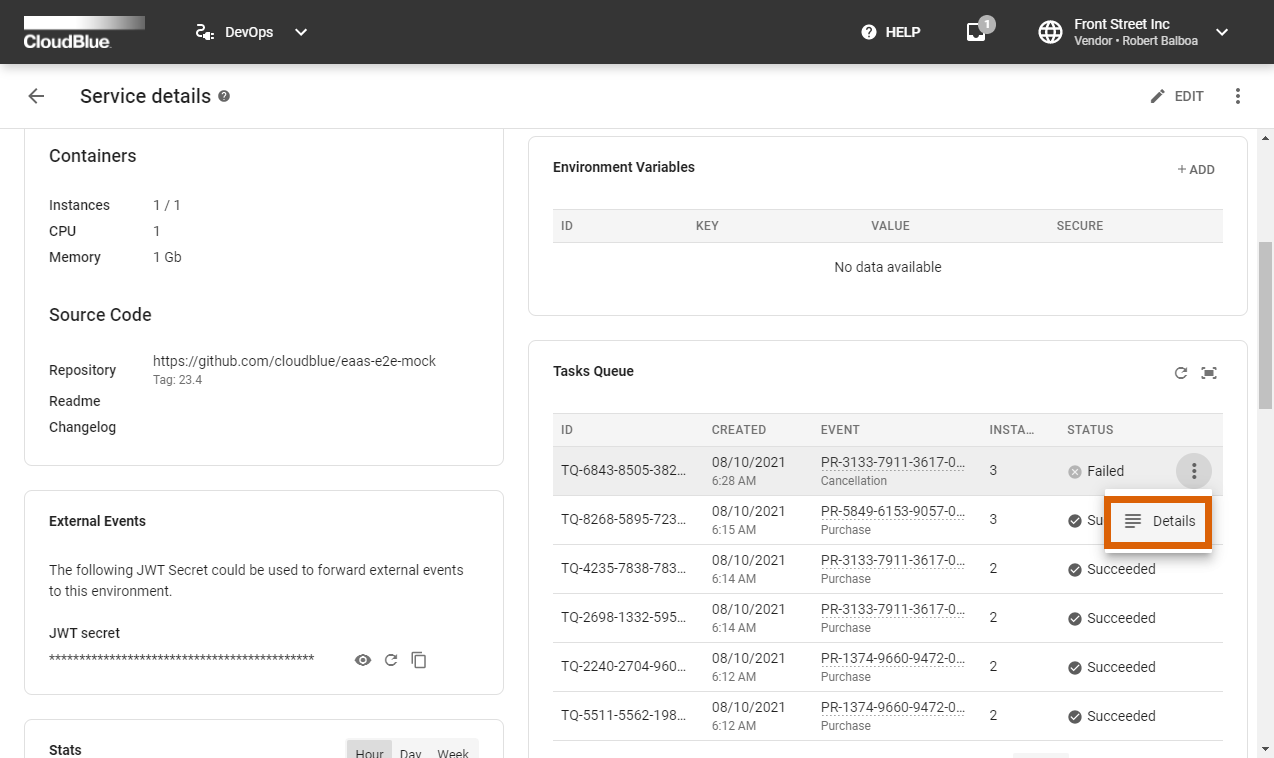
Task Details
If your task in the task queue is failed, the system allows examining your failed task details, such as a task category, error message, and more. Refer to the Extension Project documentation to learn the difference between various task categories within the DevOps module.
Locate your failed task under Task Queue via the Extension Details screen. Thereafter, click on the vertical ellipsis (⋮) icon and select Details to access the Task Details screen.
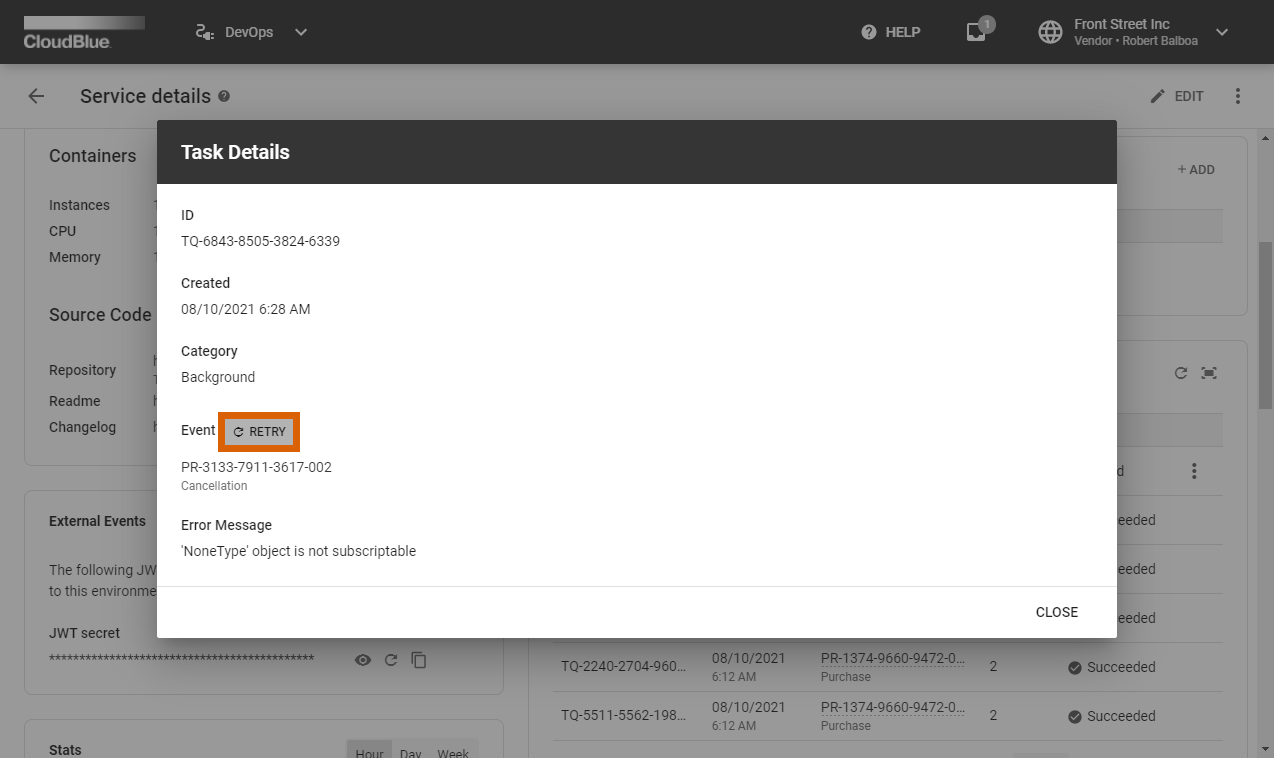
Note that the system allows you to manually restart your failed task. Click the Retry button from the Task Details screen. Therefore, the system will process your selected task once again.
Logging
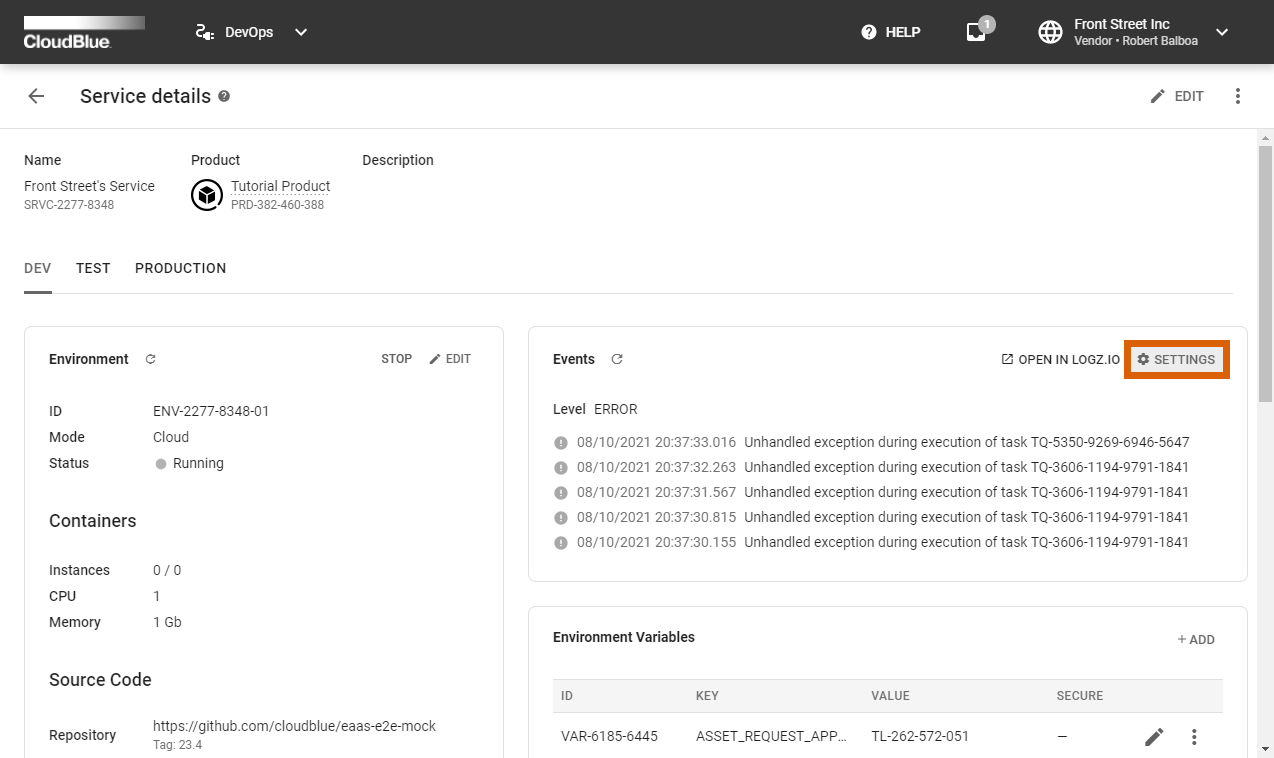
In case your environment is deployed in the Local mode, your logs will be generated locally. If your environment is running in the Cloud mode, your generated logs will be displayed within your added service details screen on Connect. Logs are used to receive detailed information about request state changes, unhandled exceptions and other events. The system allows switching logging levels as follows:
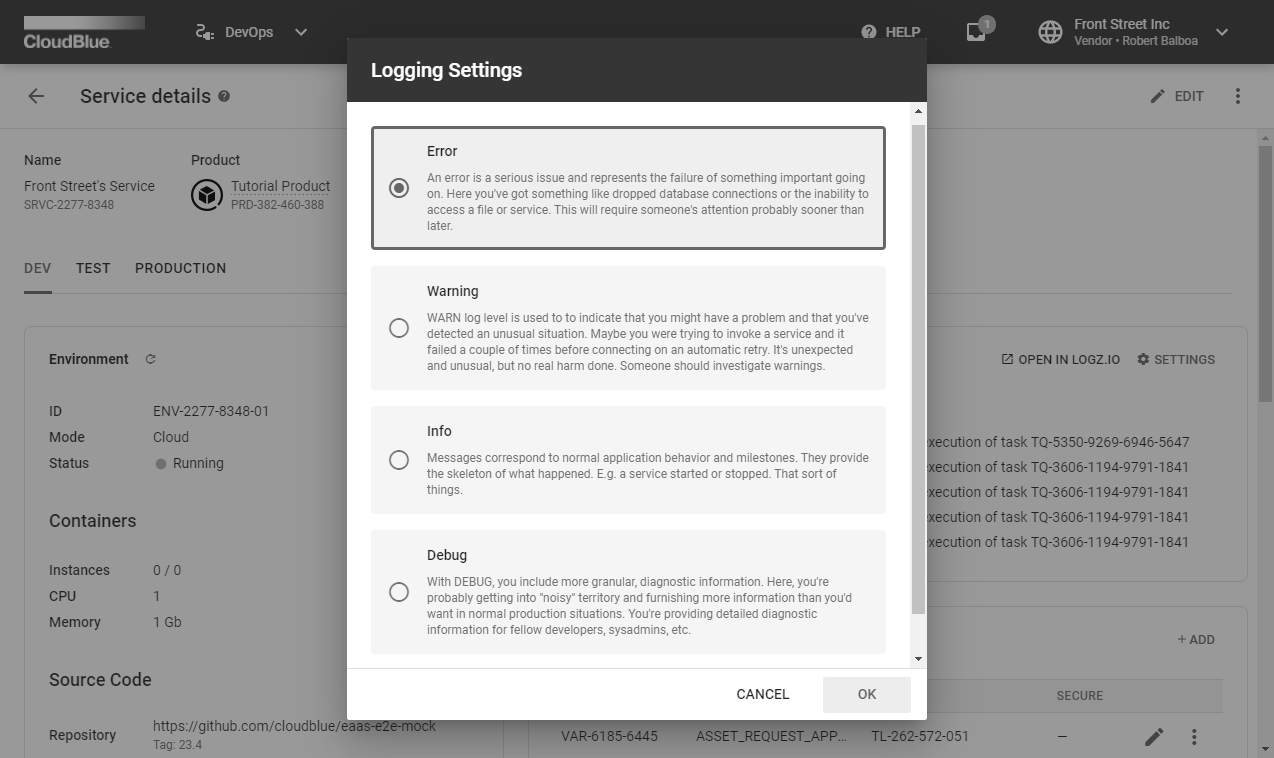
Click the Settings button in the Events section of the Extension Details screen. The system prompts you to select one of the following logging levels:
Error: An error represents a major issue or a failure of an important process. Errors are usually associated with database connection drops or with the inability to access required files or services. Thus, errors often require immediate attention.
Warning: This logging level indicates that the system detected a problem or an unusual event. For instance, in case a user tries to invoke a service and this service fails to connect the first time. Consequently, this service can be connected on an automatic retry and the system registers this unexpected or unusual event. Warnings do not represent major issues; however, it is recommended to investigate your warnings.
Info: This logging level is used to register regular events and normal application behavior. It allows understanding what is happening within your service and the system. For example, when your service is stopped or started to work.
Debug: This logging level features more granular and detailed information. This provides diagnostic data for developers, sysadmins, etc.
Note that the system also allows utilizing the logz.io service to access logging data within the Kibana interface. Use the Open in the Logz.io button to access this service.
Schedules
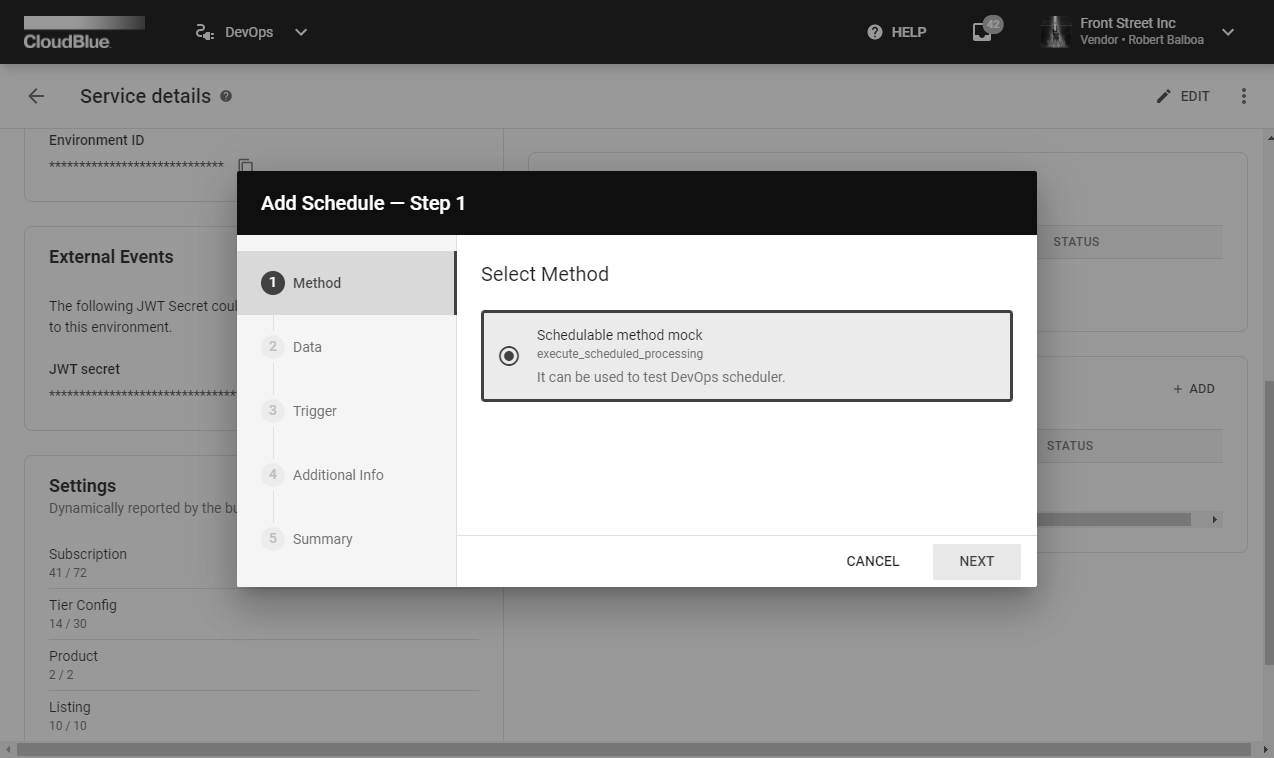
The Schedules section of the Extension Details screen, as the name suggests, is used to schedule the processing of your service tasks. Once your environment is deployed, locate the Schedules section and click the Add button. Therefore, the system launches a wizard that is used to create a new schedule for your service:
Method: The wizard prompts you to select your schedule method.
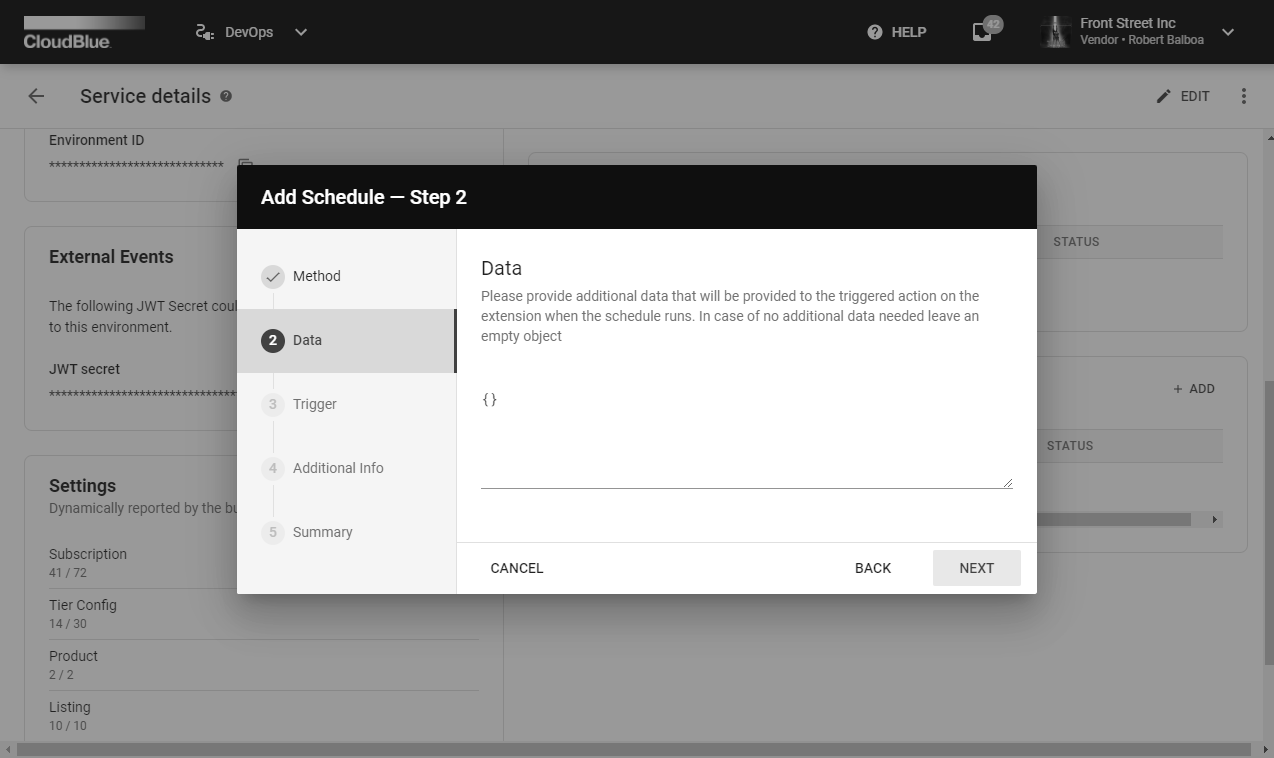
Data: Additional JSON data can be provided for your triggered action once the schedule is activated. In case no additional data is required, leave an empty JSON object.
Trigger: This step allows configuring a trigger for your schedule. The system also requires selecting one of the following trigger types:
One time: Specify date and time for one time trigger activation.
Recurring: Configure recurring trigger activation by selecting this type. Thus, the system allows specifying the number of repeated activations (e.g., every hour/day/week/month, every 2 hours/days/weeks/months, etc.) and start date/time for your trigger activations. It is also possible to check the End Date checkbox and select date and time to stop your recurring trigger activations.
Note: In case the monthly schedule is selected, the system will automatically trigger activation at the beginning of each month. Therefore, if a different date is required, it is necessary to provide a cron expression for this task.
Advanced: Provide an expression for your trigger. Such expressions usually represent strings that consist of six or seven subexpressions (fields). These subexpressions describe individual details of your schedule.
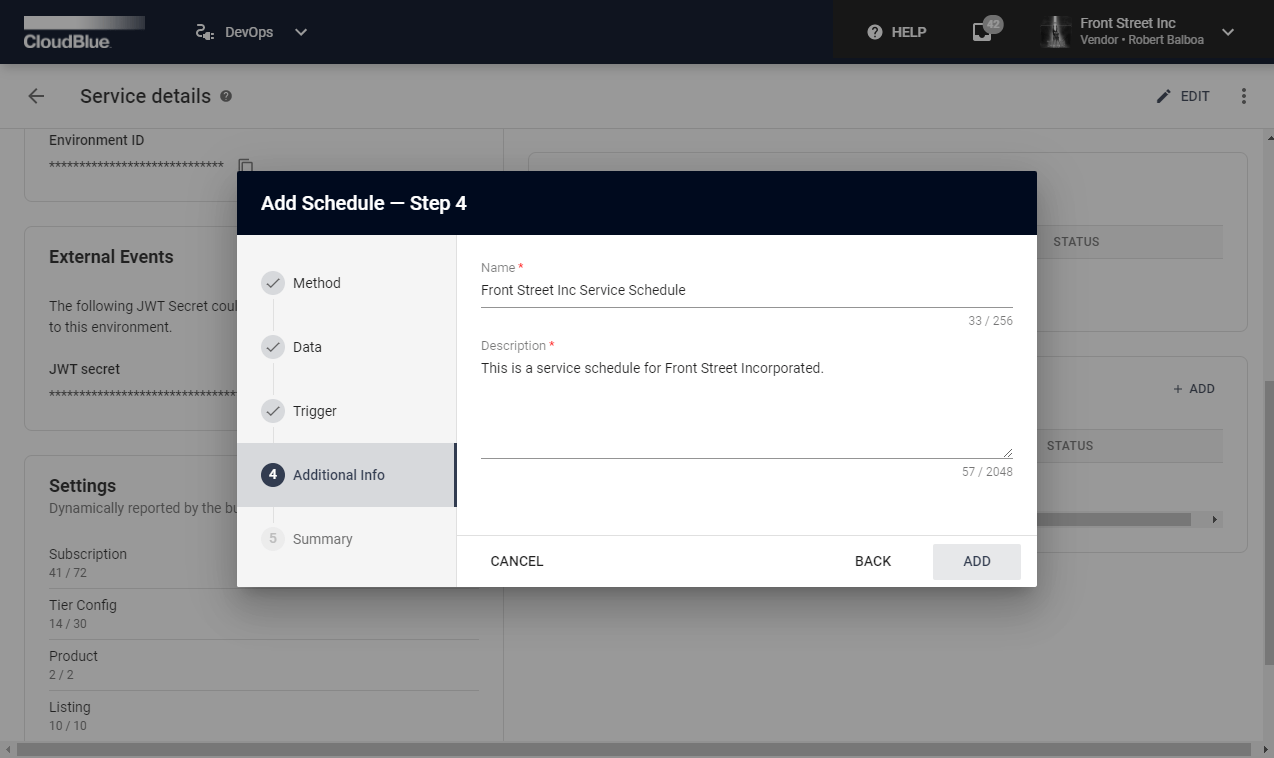
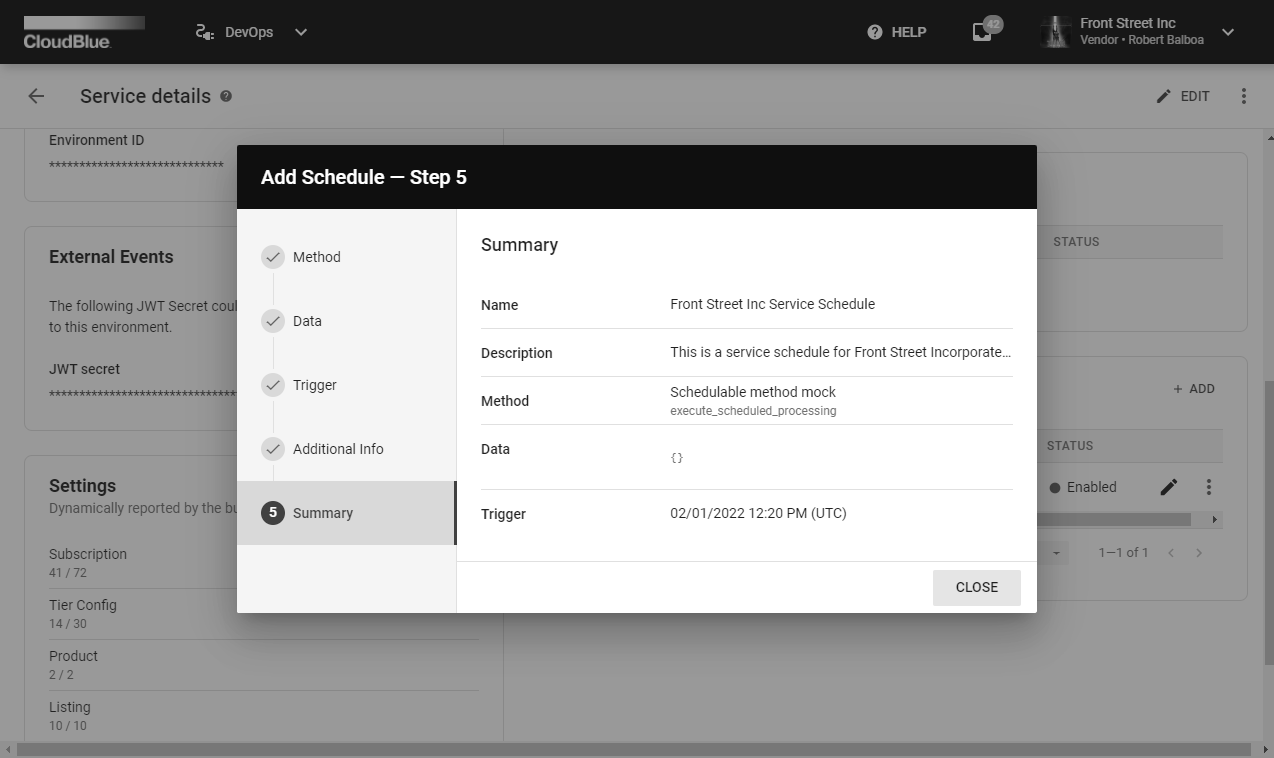
Additional Info: This wizard requires to enter a name and description for your schedule object.
Click the Add button to successfully create a schedule object. As a result, the system provides a summary for your created schedule object. Review the summary and click the Close button to finalize your schedule configuration